Authored by Matt Barrie via Medium.com,

Co-authored with Craig Tindale.
I recently watched the federal treasurer, Scott Morrison, proudly proclaim that Australia was in “surprisingly good shape”. Indeed, Australia has just snatched the world record from the Netherlands, achieving its 104th quarter of growth without a recession, making this achievement the longest streak for any OECD country since 1970.
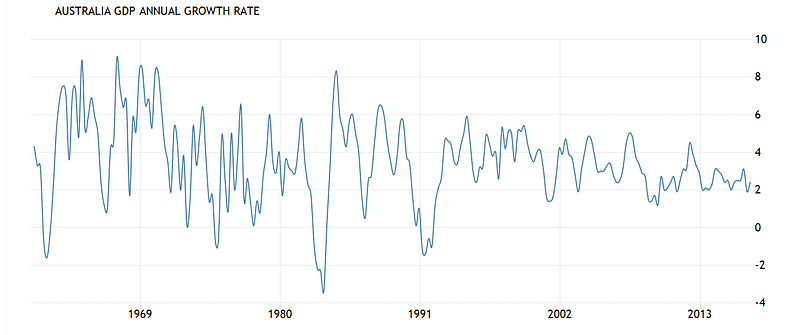
Australian GDP growth has been trending down for over forty years
Source: Trading Economics, ABS
I was pretty shocked at the complacency, because after twenty six years of economic expansion, the country has very little to show for it.
For over a quarter of a century our economy mostly grew because of dumb luck. Luck because our country is relatively large and abundant in natural resources, resources that have been in huge demand from a close neighbour.
That neighbour is China.
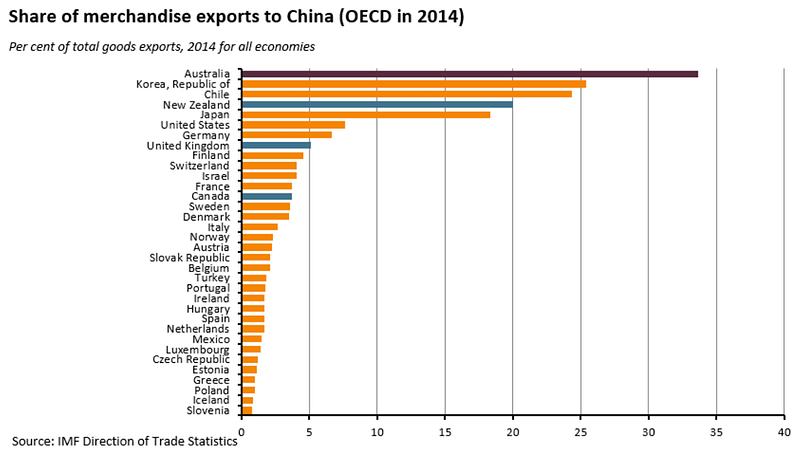
Out of all OECD nations, Australia is the most dependent on China by a huge margin, according to the IMF. Over one third of all merchandise exports from this country go to China- where ‘merchandise exports’ includes all physical products, including the things we dig out of the ground.
Source: Austrade, IMF Director of Trade Statistics
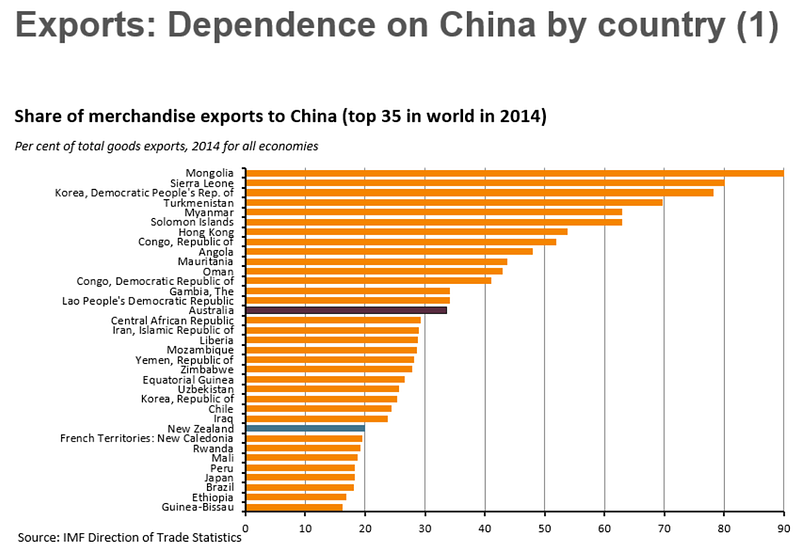
Outside of the OECD, Australia ranks just after the Democratic Republic of the Congo, Gambia and the Lao People’s Democratic Republic and just before the Central African Republic, Iran and Liberia. Does anything sound a bit funny about that?
Source: Austrade, IMF Director of Trade Statistics
As a whole, the Australian economy has grown through a property bubble inflating on top of a mining bubble, built on top of a commodities bubble, driven by a China bubble.
Unfortunately for Australia, that “lucky” free ride is just about to end.
Societe Generale’s China economist Wei Yao said recently, “Chinese banks are looking down the barrel of a staggering $1.7 trillion?—?worth of losses”. Hyaman Capital’s Kyle Bass calls China a “$34 trillion experiment” which is “exploding”, where Chinese bank losses “could exceed 400% of the U.S. banking losses incurred during the subprime crisis”.
A hard landing for China is a catastrophic landing for Australia, with horrific consequences to this country’s delusions of economic grandeur.
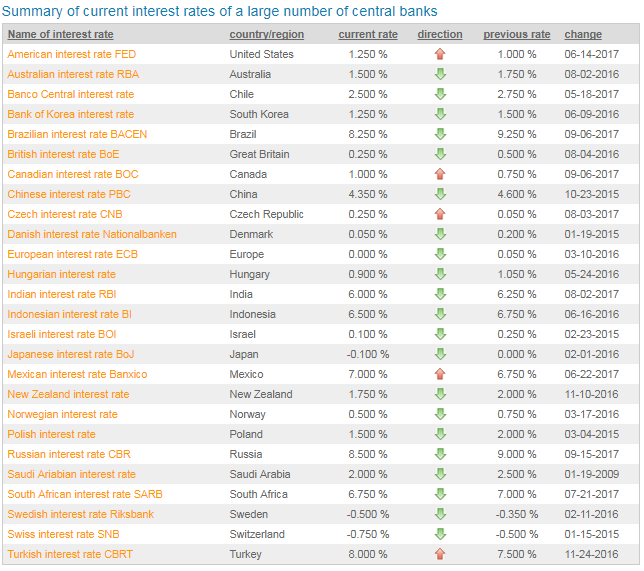
Delusions which are all unfolding right now as this quadruple leveraged bubble unwinds. What makes this especially dangerous is that it is unwinding in what increasingly looks like a global recession- perhaps even depression, in an environment where the U.S. Federal Reserve (1.25%), Bank of Canada (1.0%) and Bank of England (0.25%) interest rates are pretty much zero, and the European Central Bank (0.0%), Bank of Japan (-0.10%), and Central Banks of Sweden (-0.50%) and Switzerland (-0.75%) are at zero or negative interest rates.
Summary of Current Interest Rates from Central Banks (16th October 2017). Source: Global-rates.com
As a quick refresher of how we got here, after the Global Financial Crisis, and consequent recession hit in 2007 thanks to delinquencies on subprime mortgages, the U.S. Federal Reserve began cutting the short-term interest rate, known as the ‘Federal Funds Rate’ (or the rate at which depository institutions trade balances held at Federal Reserve Banks with each other overnight), from 5.25% to 0%, the lowest rate in history.
When that didn’t work to curb rising unemployment and stop growth stagnating, central banks across the globe started printing money which they used to buy up financial securities in an effort to drive up prices. This process was called “quantitative easing” (“QE”), to confuse the average person in the street into thinking it wasn’t anything more than conjuring trillions of dollars out of thin air and using that money to buy things in an effort to drive their prices up.
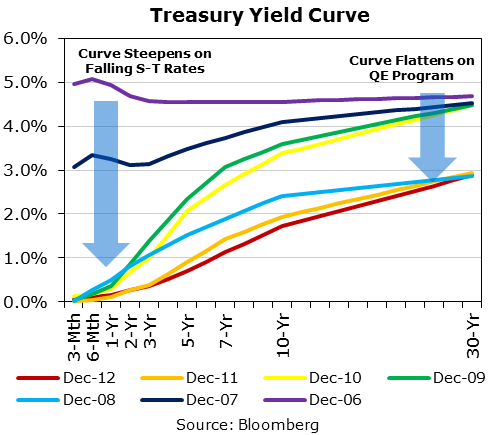
Systematic buying of treasuries and mortgage bonds by central banks caused the face value of on those bonds to increase, and since bond yields fall as their prices rise, this buying had the effect of also driving long-term interest rates down to near zero.
Both short and long term rates were driven to near zero by interest rate policy and QE. Source: Bloomberg, CME Group
In theory making money cheap to borrow stimulates investment in the economy; it encourages households and companies to borrow, employ more people and spend more money. An alternative theory for QE is that it encourages buying hard assets by making people freak out that the value of the currency they are holding is being counterfeited into oblivion.
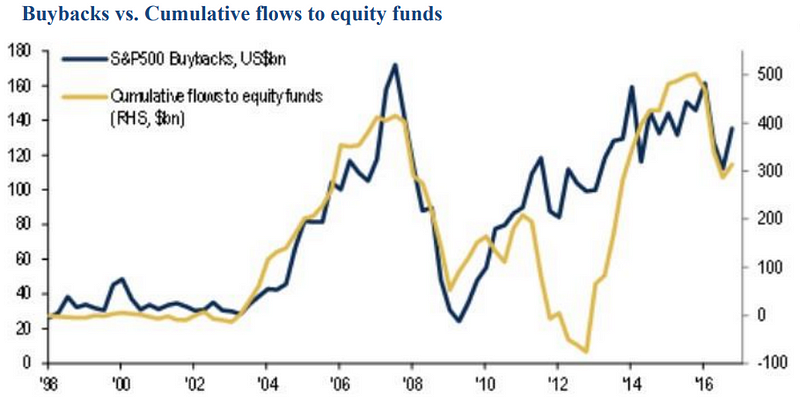
In reality, the ability to borrow cheap money was mainly used by companies to buy back their own shares, and combined with QE being used to buy stock index funds (otherwise known as exchange traded funds or “ETFs”), this propelled stock markets to hit record high after record high even though this wasn’t justified the underlying corporate performance.
Almost all flows into the equity market have been in the form of buybacks. Source: BofA Merrill Lynch Global Investment Strategy, S&P Global, EPFR Global, Convexity Maven
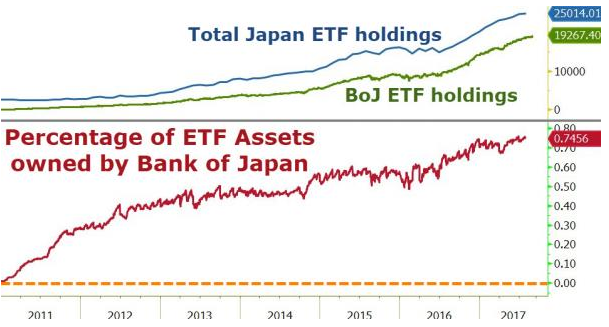
In literally a “WTF Chart of the Day” on September 11, 2017, it was reported that the central bank of Japan now holds 75% of all ETFs. No, not ‘owns units in three out of four ETFs’?—?the Bank of Japan now owns three quarters of all assets by market value in all Japanese exchange traded funds.
In today’s world Hugo Chavez wouldn’t need to nationalise assets, he could have just printed money and bought them on the open market.
Bank of Japan now owns 75% of all Japanese ETFs. Source: Zerohedge
Europe and Asia were dragged into the crisis, as major European and Asian banks were found holding billions in toxic debt linked to U.S. subprime mortgages (more than 1 million U.S. homeowners faced foreclosure). One by one, nations began entering recession and repeated attempts to slash interest rates by central banks, along with bailouts of the banks and various stimulus packages could not stymie the unfolding crisis. After several failed attempts at instituting austerity measures across a number of European nations with mounting public debt, the European Central Bank began its own QE program that continues today and should remain in place well into 2018.
In China, QE was used to buy government bonds which were used to finance infrastructure projects such as overpriced apartment blocks, the construction of which has underpinned China’s “miracle” economy. Since nobody in China could actually afford these apartments, QE was lent to local government agencies to buy these empty flats. Of course this then led to a tsunami of Chinese hot money fleeing the country and blowing real estate bubbles from Vancouver to Auckland as it sought more affordable property in cities whose air, food and water didn’t kill you.
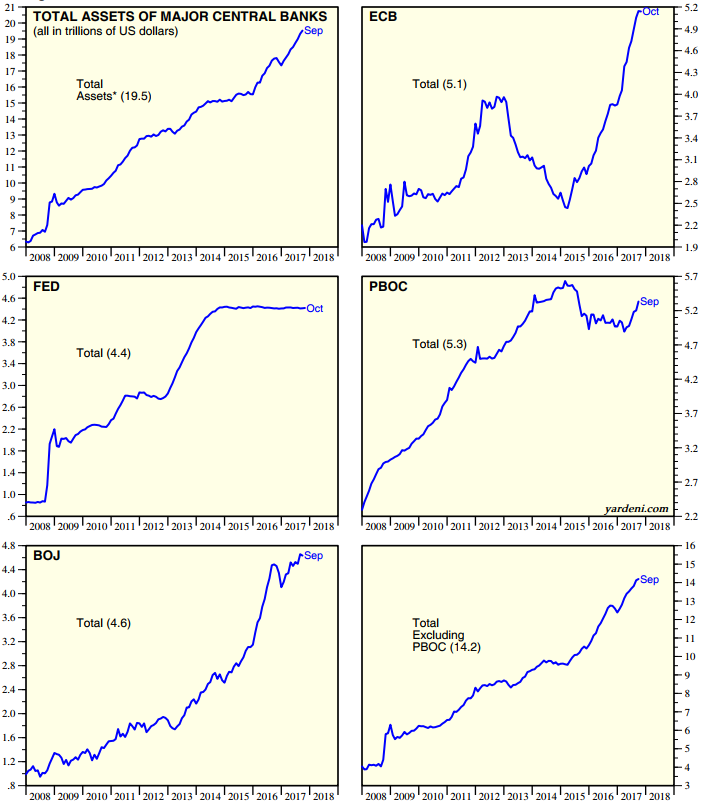
QE was only intended as a temporary emergency measure, but now a decade into printing and the central banks of the United States, Europe, Japan and China have now collectively purchased over US$19 trillion of assets. Despite the lowest interest rates in 5,000 years, the global economic growth in response to this money printing has continued to be anaemic. Instead, this stimulus has served to blow asset bubbles everywhere.
Total assets held by major central banks. Source: Haver Analytics, Yardeni Research
This money printing has lasted so long that the US economic cycle is imminently due for another downturn- the average length of each economic cycle in the U.S. is roughly 6 years. By the time the next crisis hits, there will be very few levers left for central banks to pull without getting into some really funny business.
It wasn’t until September 2017 that the U.S. Federal Reserve finally announced an end to the current program, with a plan to begin selling-off and reducing its own US$4.5 trillion portfolio beginning in October 2017.
How these central banks plan to sell these US$19 trillion in assets someday without completely blowing up the world economy is anyone’s guess. That’s about the same in value as trying to sell every single share in every single company listed on the stock markets of Australia, London, Shanghai, New Zealand, Hong Kong, Germany, Japan and Singapore. I would think a primary school student would be able to tell you that this is all going to end up going horribly wrong.
To put into perspective how perverted things are right now, in September 2017, Austria issued a 100 year euro denominated bond which yields a pathetic 2.1% per annum. That’s for one hundred years. The buyers of these bonds, who, on the balance of probability, were most likely in high school or university during the global financial crisis, think that earning a miniscule 2.1% per annum every year over 100 years is a better investment than well anything else that they could invest in- stocks, real estate, you name it, for one hundred years. They are also betting that inflation won’t be higher than 2.1% on average for one hundred years, because otherwise they would lose money. This is even though in 20 years time they’ll be holding a bond with 80 years left to go to be paid out in a currency that may no longer exist. The only way the value of these bonds will go up is if the world continues to fall apart, causing the European Central Bank to cut its interest rate further and keep it lower for 100 years. Since the ECB refinancing rate is currently zero percent, that would mean that if you wanted to borrow money from the European Central Bank, it would literally have to pay you for the pleasure of borrowing money from it. The other important thing to remember is that on maturity, everyone that bought that bond in September will be dead.
So if one naively were looking at markets, particularly the commodity and resource driven markets that traditionally drive the Australian economy, you might well have been tricked into thinking that the world was back in good times again as many have rallied over the last year or so.
The initial rally in commodities at the beginning of 2016 was caused by a bet that more economic stimulus and industrial reform in China would lead to a spike in demand for commodities used in construction. That bet rapidly turned into full blown mania as Chinese investors, starved of opportunity and restricted by government clamp downs in equities, piled into commodities markets.
This saw, in April of 2016, enough cotton trading in a single day to make a pair of jeans for everyone on the planet, and enough soybeans for 56 billion servings of tofu, according to Bloomberg in a report entitled “The World’s Most Extreme Speculative Mania Unravels in China”.
Market turnover on the three Chinese exchanges jumped from a daily average of about $78 billion in February to a peak of $261 billion on April 22, 2016?—?exceeding the GDP of Ireland. By comparison, Nasdaq’s daily turnover peaked in early 2000 at $150 billion.
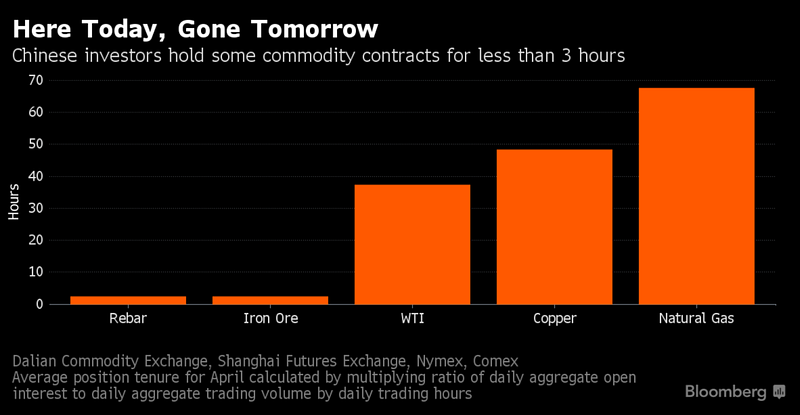
While volume exploded, open interest didn’t. New contracts were not being created, volume instead was churning as the hot potato passed between speculators, most commonly in the night session, as consumers traded after work. So much so that sometimes analysts wondered whether the price of iron ore is set by the market tensions between iron ore miners and steel producers, or by Chinese taxi drivers trading on apps.
Average futures contract holding times for various commodities. Source: Bloomberg
In April 2016, the average holding period for steel rebar and iron ore contracts was less than 3 hours. The Chief Executive of the London Metal Exchange, said “Why should steel rebar be one of the world’s most actively-traded futures contracts? I don’t think most people who trade it know what it is”.
Steel, of course, is made from iron ore, Australia’s biggest export, and frequently the country’s main driver of a trade surplus and GDP growth.
Australia is the largest exporter of iron ore in the world, with a 29% global share in 2015–16 and 786Mt exported, and at $48 billion we’re responsible for over half of all global iron ore exports by value. Around 81% of our iron ore exports go to China.
Unfortunately, in 2017, China isn’t as desperate anymore for iron ore, where close to 50% of Chinese steel demand comes from property development, which is under stress as house prices temper and credit tightens.
In May 2017, stockpiles at Chinese ports were at an all time high, with enough to build 13,000 Eiffel Towers. Last January, China pledged “supply-side reforms” for its steel and coal sectors to reduce excessive production capacity. In 2016, capacity was cut by 6 percent for steel and and 8 percent for coal.
In the first half of 2017 alone, a further 120 million tonnes of low-grade steel capacity was ordered to close because of pollution. This represents 11 percent of the country’s steel capacity and 15 percent of annual output. While this will more heavily impact Chinese-mined ore than generally higher-grade Australian ore, Chinese demand for iron ore is nevertheless waning.
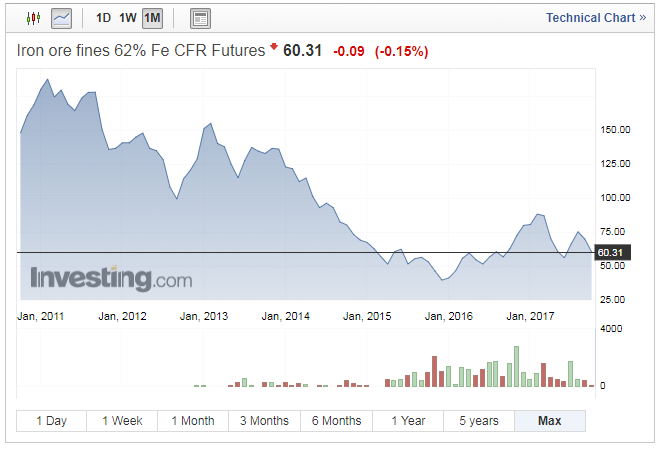
Over the last six years, the price of iron ore has fallen 60%.
Iron ore fines 62% Fe CFR Futures. Source: Investing.com
While the price of iron ore briefly rallied after the U.S. election in anticipation of increasingly less likely Trumponomics, DBS Bank expects that global demand for steel will remain stagnant for at least the next 10–15 years. The bank forecasts that prices are likely to be rangebound based on estimates that Chinese steel demand and production have peaked and are declining, that there are no economies to buffer this slowdown in China, and that major steel consuming industries are also facing overcapacity issues or are expected to see lower growth.
Australia’s second biggest export is coal, being the largest exporter in the world supplying about 38% of the world’s demand. Production has been on a tear, with exports increasing from 261Mt in 2008 to 388Mt in 2016.
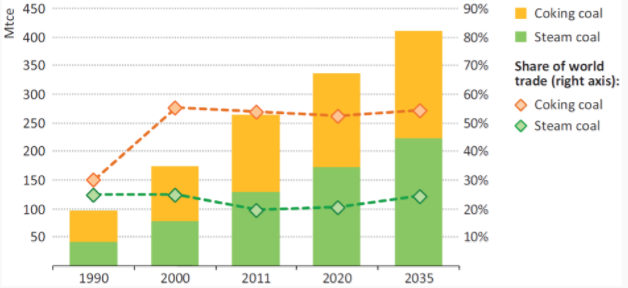
Australian Coal Exports by Type 1990–2035 (IEA Core Scenario). Source: International Energy Agency, Minerals Council of Australia
While exports increased by 49% over that time period, the value of those exports has collapsed 38%, from $54.7 billion to $34 billion.
The only bright side for Australian coal in 2017 was that, unexpectedly, Cyclone Debbie wiped out several railroads and forced the closure of ports and mining operations, which has caused a temporary spike in coal prices.
Australian Thermal Coal Prices. (12,000- btu/pound, <1% sulfur, 14% ash, FOB Newcastle/Port Kembla, US$ / metric ton). Source: IMF, Quandl
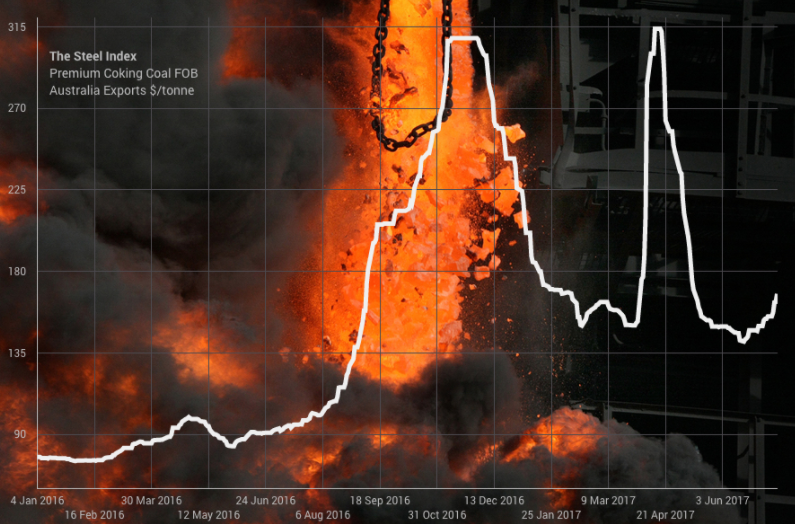
Australian Premium Coking Coal FOB $/tonne. Source: Mining.com
There are two main types of coal- thermal coal, which is burnt as fuel, and coking coal, which is used in the manufacture of steel. The prospects for coking coal are obviously tied to the prospects of the steel market, which are not particularly good.
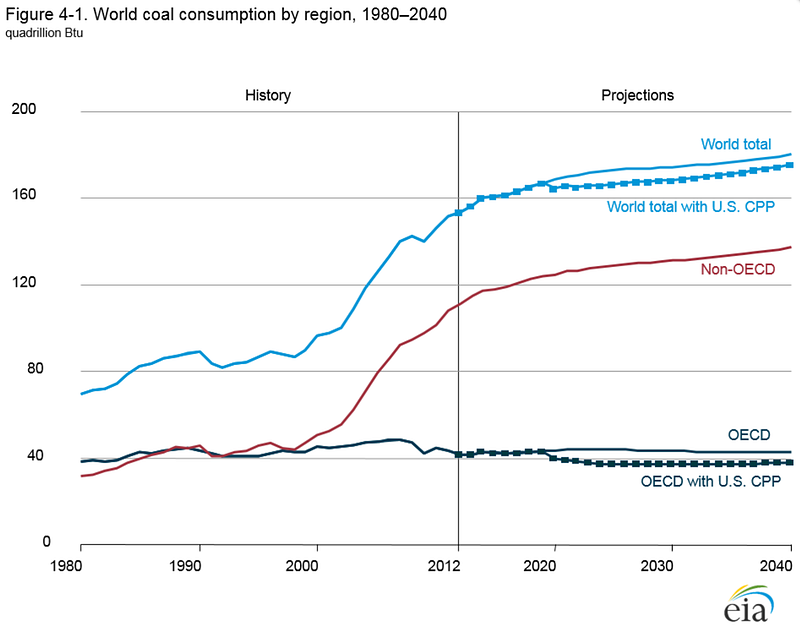
Thermal coal, on the other hand, is substantially on the nose, and while usage is still climbing in non-OECD nations, it is already in terminal decline in OECD nations. Recently, in April 2017, the United Kingdom experienced its first day without burning coal for electricity since the industrial revolution in the 1800s.
World Coal Consumption by Region 1980–2040 (forecast). Source: US Energy Information Administration
Australia’s main export markets for coal are Japan and China, two markets in which the use of coal is forecast to decline through 2040.
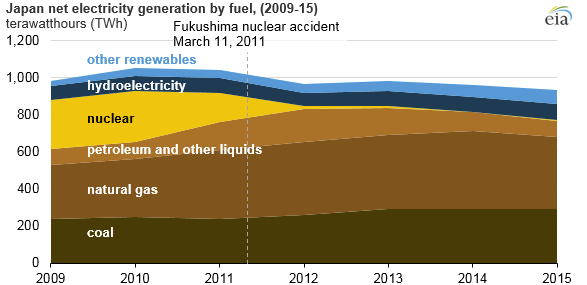
Australia’s top export market for coal is Japan, and the unfortunate news is that the ramp up in coal exports here is a short lived adaptation after power companies idled their nuclear reactors in the wake of the Fukushima disaster. Between a zombie economy and fertility levels far below the replacement rate, Japan’s population is shrinking and thus naturally net electricity generation has also been declining in Japan since 2010.
Japan net electricity generation by fuel 2009–15. Source: US Energy Information Administration
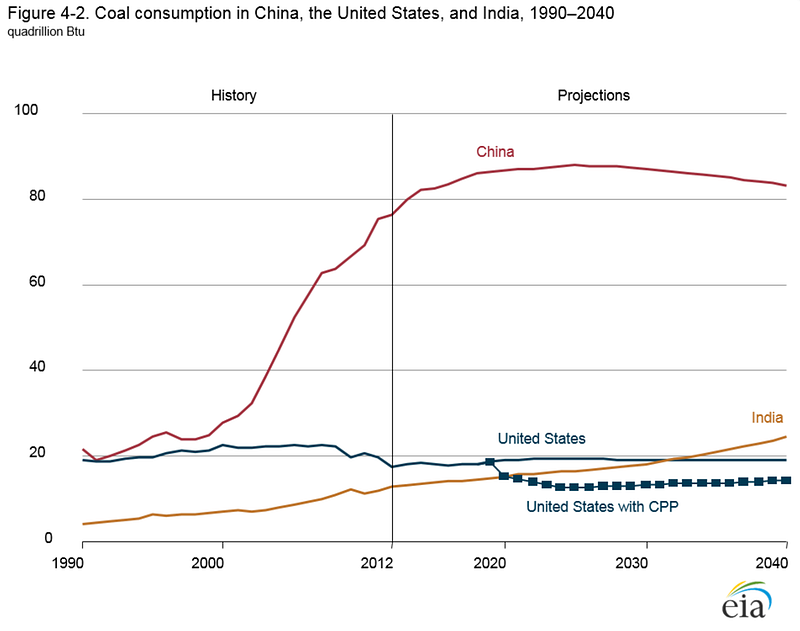
Coal consumption in China has dropped three years in a row, and in January 2017, 100 coal fired power plants were cancelled. China has announced that it is spending a whopping $360 billion on renewables through 2020, and this year is implementing the world’s biggest cap-and-trade carbon market to curb emissions.
Blind to the reality of this situation, Australia is ramping up coal production while China commits to ending coal imports in the very near future in what can only be described as a last-ditch “dig it up now, or never” situation.
Major Export Markets for Australian Coal (2014). Source: Wikipedia
Coal Consumption in China, the US and India 1990–2040. Source: US Energy Information Administration
Coal exports rely on substantial investment by investors who build significant infrastructure, like ports and rail, the cost of which is shared among users according to volume. If a coal company defaults then the remaining coal companies pay extra to collectively cover the loss. A single failure can significantly increase the cost to the other users and can in turn cause pressure on the remaining partners. As this happens, their bonds get downgraded causing balance sheet erosion that ultimately can impact project viability.
Moodys recently downgraded the ratings of several Australian coal ports- including Adani’s Abbot Point- after U.S. coal miner Peabody Energy, which ships through these ports, defaulted on several of its bonds.
Despite all of this, some in government can’t get their head around why the Big Four banks and major investment banks including, Citigroup, JPMorgan, Goldman Sachs, Deutsche Bank, Royal Bank of Scotland, HSBC and Barclays are not keen to fund the gargantuan Carmichael coal project in Queensland’s Galilee Basin.
The now former deputy Prime Minister of Australia, Barnaby Joyce, a New Zealand-Australian politician who served unconstitutionally as the Deputy Prime Minister of Australia, wants Australian taxpayers to be the lenders of last resort to Adani, an Indian miner, for $900 million to build a rail line from their proposed Carmichael Thermal Coal Mine to the port at Abbot Point, where it would be shipped to India. Adani is looking for a handout because, unsurprisingly, the banks knocked them back because the project was too risky and the public backlash against the project has been overwhelming. If it does go ahead, it is likely to be a rail line to nowhere, because by the time it opens, there is a chance that the project will be unviable.
Unless the government steps in, it’s increasingly more likely that the project will go the way of the Wiggins Island coal export terminal, the fraught development originally conceived by Glencore and seven other project partners in 2008, at the literal top of the market for coal. Since conception, three of the project’s original proponents?—?Caledon Coal, Bandanna Energy and Cockatoo Coal?—?have gone into administration. Only one of the project’s three stages has been completed, at twice the estimated cost. The five remaining take-or-pay owners have been left with more than US$4 billion in debt to repay and hope is fading on any any chance of refinancing before it all falls due.
What makes the Adani project so absurd is that India has recently cancelled more than 500 gigawatts of planned coal projects and the Indian government has said, however realistic that may be, that it intends to phase out thermal coal imports- precisely the type of coal Carmichael produces- entirely by 2020.
It’s even more perplexing when you consider that 2016 was the year that solar became cheaper than coal, with some countries generating electricity from sunshine for less than 3 cents per kilowatt-hour (which is half the average global cost of coal power) and by October 2017, wind power is now cheaper than coal in India.
Furthermore, global policy to limit the rise in temperatures by 2% could result in a 40% drop in the trade of thermal coal, which would cut Australia’s exports of such by 35%, according to a study by Wood Mackenzie. In 2014, thermal coal was 51% of our coal exports by volume, and this is precisely the type of coal that will be mined by Adani at Carmichael.
Given that Baarnaby’s service was ruled invalid, one can only hope that his actions regarding Government funding for the Adani project might also be invalidated and we can put this flawed project to bed.
Recent events have given manifest life to Mark Carney’s landmark 2015 speech in which Carney, the Governor of the Bank of England, warned that if the world is to limit global warming to below 2 degrees, then the estimates for how much carbon the world can burn makes between 66% and 80% of global oil, gas and coal reserves unusable.
In an essay last year, David Fickling wrote “More than half the assets in the global coal industry are now held by companies that are either in bankruptcy proceedings or don’t earn enough money to pay their interest bills, according to data compiled by Bloomberg. In the U.S., only three of 12 large coal miners traded on public markets escape that ignominious club, separate data show”.
So while our politicians gaze wistfully in parliaments at a lump of coal, undoubtedly the days are clearly numbered for our second largest export.
Losing coal as an export will blow a $34 billion dollar per annum hole in the current account, and there’s been no foresight by successive governments to find or encourage modern industries to supplant it.

Australian Treasurer Scott Morrison gazes wistfully at a lump of coal. Source: AAP, Lukas Coch
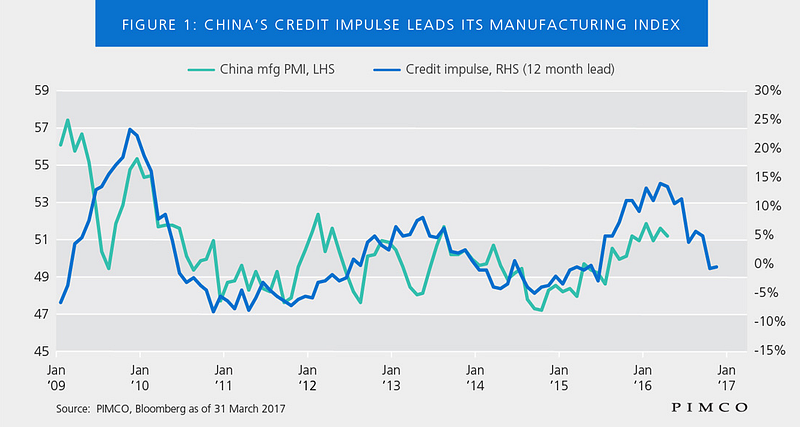
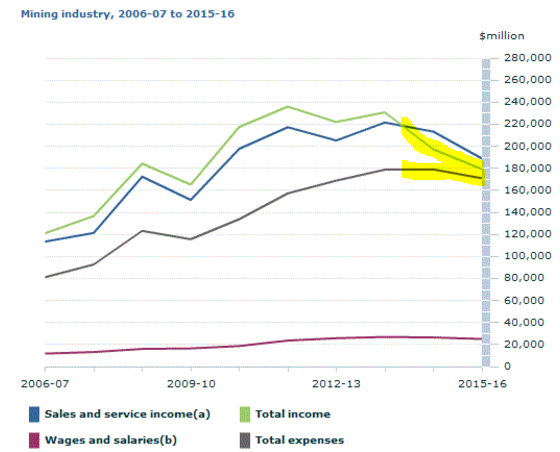
What is more shocking is that despite the gargantuan amount of money that China has been pumping into the system since 2014, Australia’s entire mining industry- which is completely dependent on China- has struggled to make any money at all.
Across the entire industry revenue has dropped significantly while costs have continued to rise.
China credit impulse leads its manufacturing index (which in turn fuels commodities). Source: PIMCO
According to the Australian Bureau of Statistics, in 2015–16 the entire Australian mining industry which includes coal, oil & gas, iron ore, the mining of metallic & non-metallic minerals and exploration and support services made a grand total of $179 billion in revenue with $171 billion of costs, generating an operating profit before tax of $7 billion which representing a wafer thin 3.9% margin on an operating basis. In the year before it made a 8.4% margin.
Collectively, the entire Australian mining industry (ex-services) would be loss making in 2016–17 if revenue continued to drop and costs stayed the same. Yes, the entire Australian mining industry.
Collectively, the entire Australian mining industry (ex-services) would be loss making in 2016–17 if revenue continued to drop and costs stayed the same. Source: Australian Bureau of Statistics
Our “economic miracle” of 104 quarters of GDP growth without a recession today doesn’t come from digging rocks out of the ground, shipping the by-products of dead fossils and selling stuff we grow any more. Mining, which used to be 19% of GDP, is now 6.8% and falling. Mining has fallen to the sixth largest industry in the country. Even combined with agriculture the total is now only 10% of GDP.
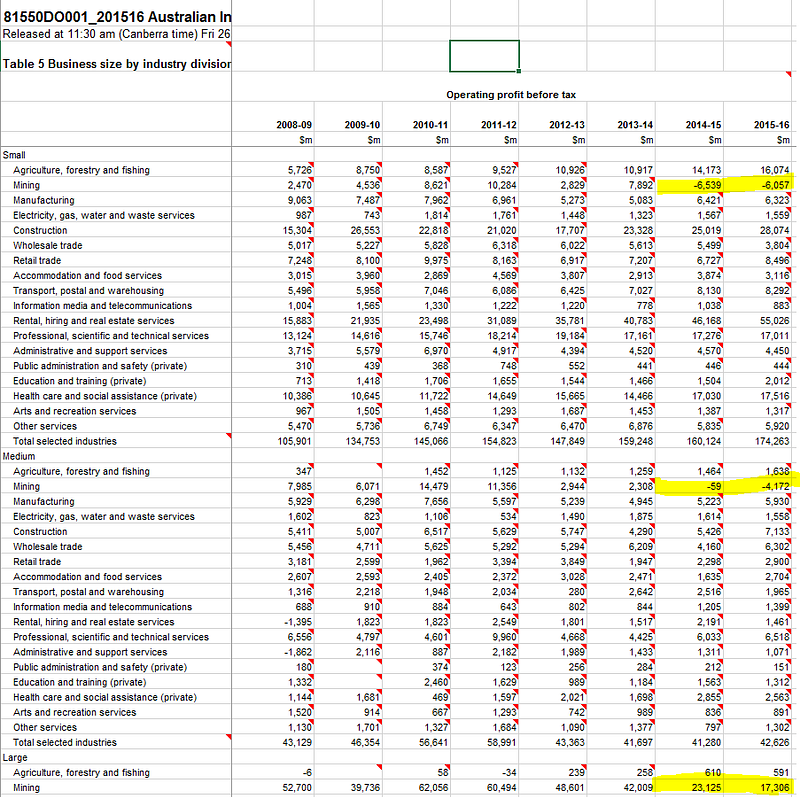
Operating profit before tax by Australian Industry- the entire small and medium mining industry collectively has been loss making from 2014–16 on an operating basis. Source: Australian Bureau of Statistics
Mineral production in regional Western Australia, where 99% of Australia’s iron ore is mined, contributed only 6.5 percent to Australia’s GDP growth in 2016.
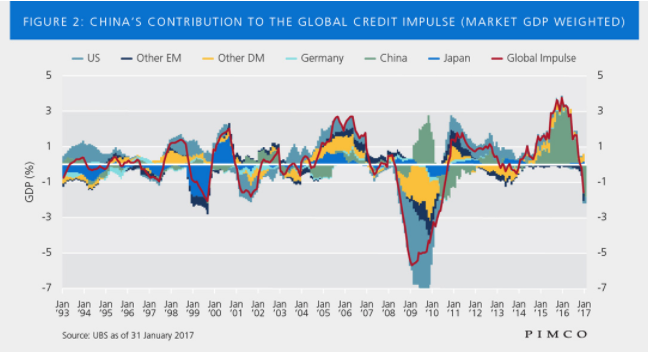
To make matters worse, in 2017 there has been a sharp downturn in Chinese credit impulse (rate of change), which is combined with a negative, and falling global credit impulse. According to PIMCO’s Gene Fried “the question now is not if China slows, but rather how fast”. This will cause even more problems for Australia’s flagging resources sector.
China’s contribution to the global credit impulse (market GDP weighted). Source: PIMCO
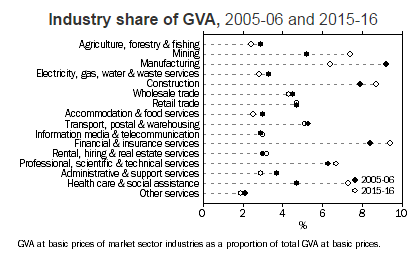
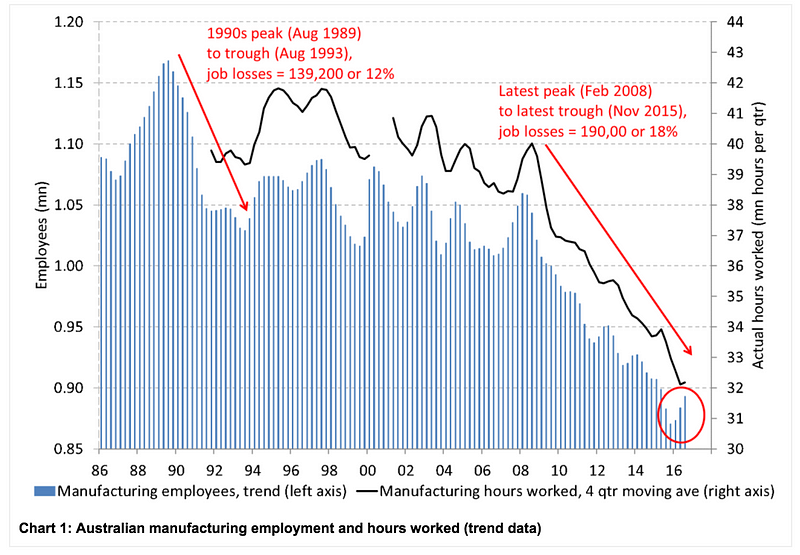
The “economic miracle” of GDP growth is also certainly not from manufacturing, which has collapsed in the last decade from 10.8% to 6.6% of Gross Value Add, and has grown by… negative 275,000 jobs since the 1990s.
Industry share of Gross Value Add 2005–6 versus 2015–6. Source: Australian Bureau of Statistics
This is even before the exit of Australia’s last two remaining car manufacturers, Toyota and Holden, who both shut up shop in 2017. Ford closed last year.
Australian Manufacturing Employment and Hours Worked. Source: AI Group
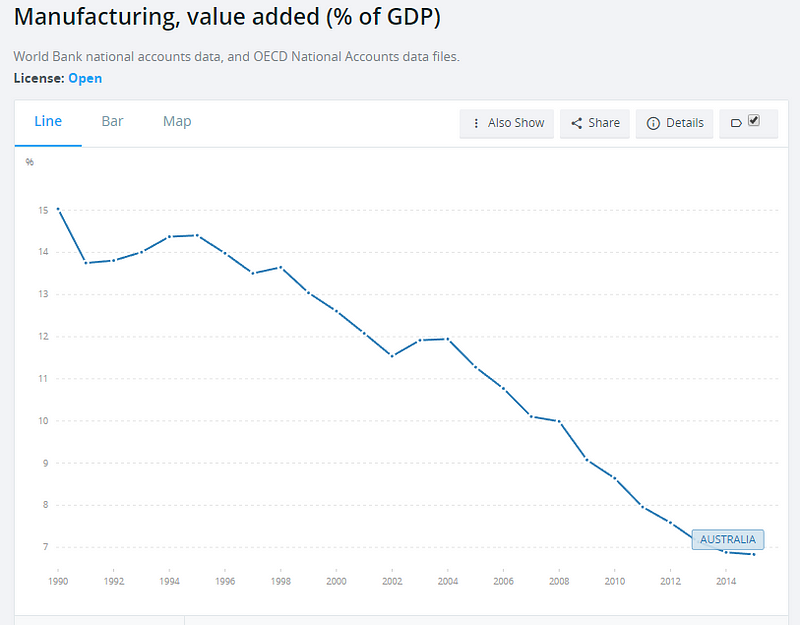
In the 1970s, Australia was ranked 10th in the world for motor vehicle manufacturing. No other industry has replaced it. Today, the entire output of manufacturing as a share of GDP in Australia is half of the levels where they called it “hollowed out” in the U.S. and U.K.
In Australia in 2017, manufacturing as a share of GDP is on par with a financial haven like Luxembourg. Australia doesn’t make anything anymore.
Manufacturing value add (% of GDP) for Australia. Source: World Bank & OECD
With an economy that is 68% services, as I believe John Hewson put it, the entire country is basically sitting around serving each other cups of coffee or, as the Chief Scientist of Australia would prefer, smashed avocado.
David Llewellyn-Smith recently wrote that this is unsurprising as “the Australian economy is now structurally uncompetitive as capital inflows persistently keep its currency too high, usually chasing land prices that ensure input costs are amazingly inflated as well.
Wider tradables sectors have been hit hard as well and Australian exports are now a lousy 20% of GDP despite the largest mining boom in history.
The other major economic casualty has been multifactor productivity (the measure of economic performance that compares the amount of goods and services produced to the amount of combined inputs used to produce those goods and services). It has been virtually zero for fifteen years as capital has been consistently and massively mis-allocated into unproductive assets. To grow at all today, the nation now runs chronic twin deficits with the current account (value of imports to exports) at -2.7% and a budget deficit of -2.4% of GDP.”
The Reserve Bank of Australia has cut interest rates by 325 basis points since the end of 2011, in order to stimulate the economy, but I can’t for the life of me see how that will affect the fundamental problem of gyrating commodity prices where we are a price taker, not a price maker, into an oversupplied market in China.
This leads me to my next question- where has this growth come from?
Successive Australian governments have achieved economic growth by blowing a property bubble on a scale like no other.
A bubble that has lasted for 55 years and seen prices increase 6556% since 1961, making this the longest running property bubble in the world (on average, “upswings” last 13 years).
In 2016, 67% of Australia’s GDP growth came from the cities of Sydney and Melbourne where both State and Federal governments have done everything they can to fuel a runaway housing market. The small area from the Sydney CBD to Macquarie Park is in the middle of an apartment building frenzy, alone contributing 24% of the country’s entire GDP growth for 2016, according to SGS Economics & Planning.
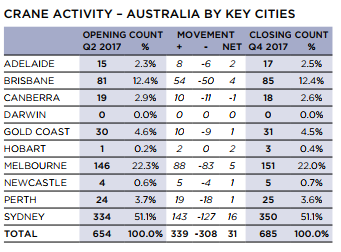
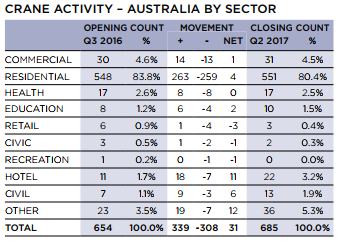
According to the Rider Levett Bucknall Crane Index, in Q4 2017 between Sydney, Melbourne and Brisbane, there are now 586 cranes in operation, with a total of 685 across all capital cities, 80% of which are focused on building apartments. There are 350 cranes in Sydney alone.
Crane Activity?—?Australia by Key Cities & Sector. Source: RLB
By comparison, there are currently 28 cranes in New York, 24 in San Francisco and 40 in Los Angeles. There are more cranes in Sydney than Los Angeles (40), Washington DC (29), New York (28), Chicago (26), San Francisco (24), Portland (22), Denver (21), Boston (14) and Honolulu (13) combined. Rider Levett Bucknall counts less than 175 cranes working on residential buildings across the 14 major North American markets that it tracked in 3Q17, which is half of the number of cranes in Sydney alone.
According to UBS, around one third of these cranes in Australian cities are in postcodes with ‘restricted lending’, because the inhabitants have bad credit ratings.
This can only be described as completely “insane”.
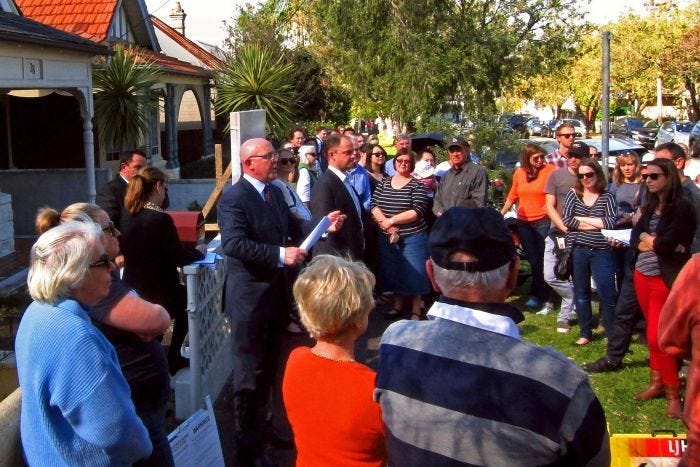
That was the exact word used by Jonathan Tepper, one of the world’s top experts in housing bubbles, to describe “one of the biggest housing bubbles in history”. “Australia”, he added, “is the only country we know of where middle-class houses are auctioned like paintings”.
An Auctioneer yells out bids in the middle class suburb of Cammeray. Source: Reuters
Our Federal government has worked really hard to get us to this point.
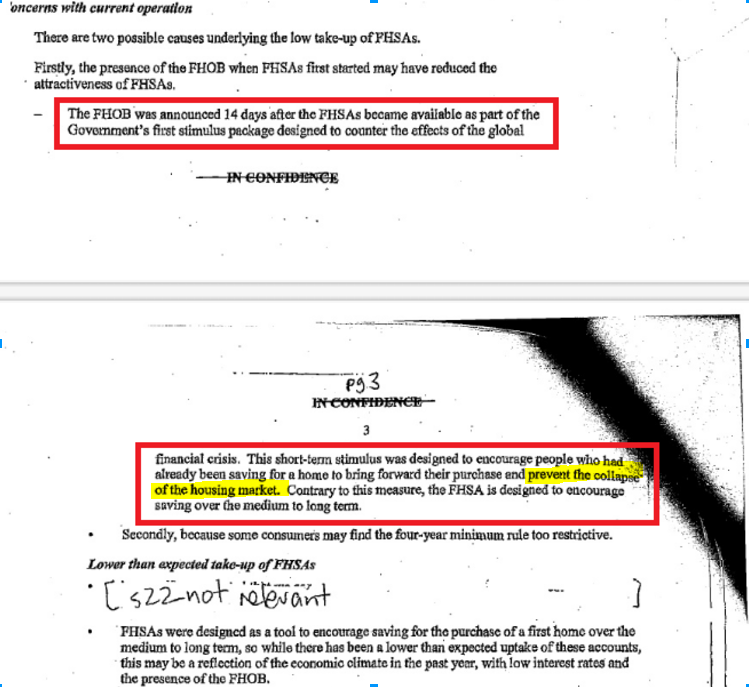
Many other parts of the world can thank the Global Financial Crisis for popping their real estate bubbles. From 2000 to 2008, driven in part by the First Home Buyer Grant, Australian house prices had already doubled. Rather than let the GFC take the heat out of the market, the Australian Government doubled the bonus. Treasury notes recorded at the time say that it wasn’t launched to make housing more affordable, but to prevent the collapse of the housing market.
Treasury Executive Minutes. Source: Treasury, The First Home Owner’s Boost
Already at the time of the GFC, Australian households were at 190% debt to net disposable income, 50% more indebted than American households, but then things really went crazy.
The government decided to further fuel the fire by “streamlining” the administrative requirements for the Foreign Investment Review Board so that temporary residents could purchase real estate in Australia without having to report or gain approval.
It may be a stretch, but one could possibly argue that this move was cunningly calculated, as what could possibly be wrong in selling overpriced Australian houses to the Chinese?
I am not sure who is getting the last laugh here, because as we subsequently found out, many of those Chinese borrowed the money to buy these houses from Australian banks, using fake statements of foreign income. Indeed, according to the AFR, this was not sophisticated documentation?—?Australian banks were being tricked with photoshopped bank statements that can be bought online for as little as $20.
UBS estimates that $500 billion worth of “not completely factually accurate” mortgages now sit on major bank balance sheets. How much of that will go sour is anyone’s guess.
Llewellyn-Smith writes, “Five prime ministers in [seven] years have come and gone as standards of living fall in part owing to massive immigration inappropriate to economic circumstances and other property-friendly policies. The most recent national election boiled down to a virtual referendum on real estate taxation subsidies. The victor, the conservative Coalition party, betrayed every market principle it possesses by mounting an extreme fear campaign against the Labor party’s proposal to remove negative gearing. This tax policy allows more than one million Australians to engage in a negative carry into property in the hope of capital gains. In a nation of just 24 million, 1.3 million Australians lose an average of $9,000 per annum on this strategy thanks to the tax break.”
The astronomical rise in house prices certainly isn’t supported by employment data. Wage growth is at a record low of just 1.9% year on year in 2Q17, the lowest figure since 1988. The average Australian weekly income has gone up $27 to $1,009 since 2008, that’s about $3 a year.
Private sector wage price index (annual percentage). Source: SMH, Australian Bureau of Statistics
Household income growth has collapsed since 2008 from over 11% to just 3% in 2015, 2016 and 2017. This is one sixth the rate that houses went up in Sydney in the last year.
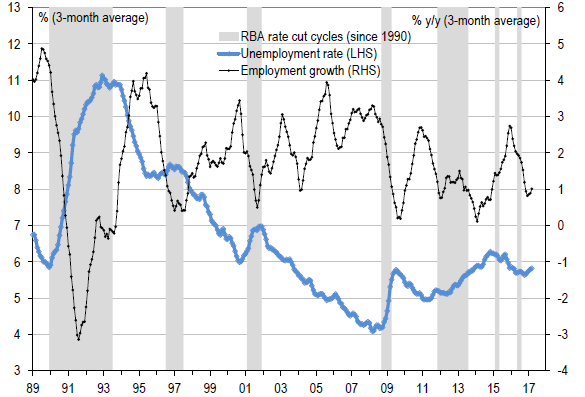
Employment growth is at an anaemic 1% year on year in 4Q16, and the unemployment rate has been trending up over the last decade to 5.6%.
Unemployment rate and Employment growth. Source: ABS, RBA, UBS
Foreign buying driving up housing prices has been a major factor in Australian housing affordability, or rather unaffordability.
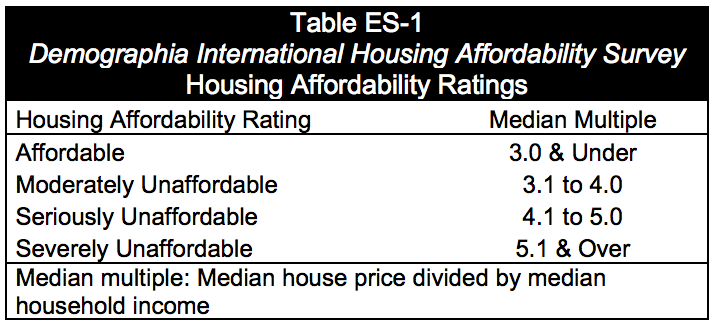
Urban planners say that a median house price to household income ratio of 3.0 or under is “affordable”, 3.1 to 4.0 is “moderately unaffordable”, 4.1 to 5.0 is “seriously unaffordable” and 5.1 or over “severely unaffordable”.
Demographia International Housing Affordability Survey. Source: Demographia
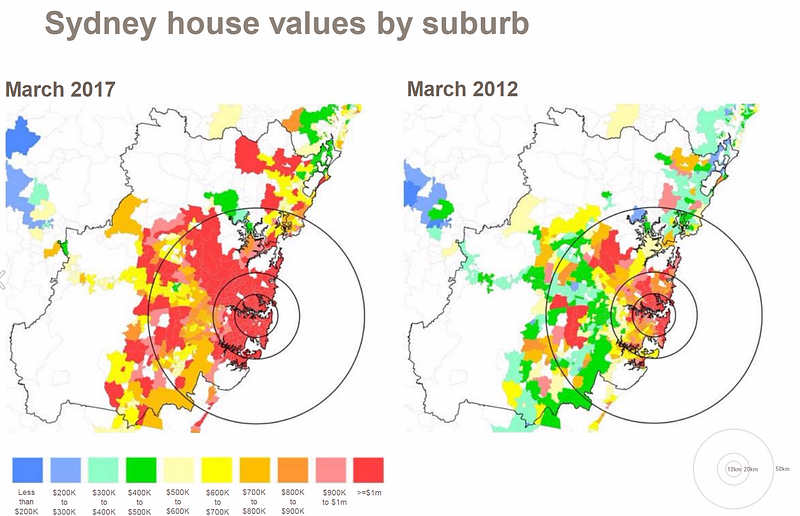
At the end of July 2017, according to Domain Group, the median house price in Sydney was $1,178,417 and the Australian Bureau of Statistics has the latest average pre-tax wage at $80,277.60 and average household income of $91,000 for this city. This makes the median house price to household income ratio for Sydney 13x, or over 2.6 times the threshold of “severely unaffordable”. Melbourne is 9.6x.
Sydney House values by Suburb. Source: Core Logic
This is before tax, and before any basic expenses. The average person takes home $61,034.60 per annum, and so to buy the average house they would have to save for 19.3 years- but only if they decided to forgo the basics such as, eating. This is neglecting any interest costs if one were to borrow the money, which at current rates would approximately double the total purchase cost and blow out the time to repay to around 40 years.
Ex-deputy Prime Minister Barnaby Joyce recently said to ABC Radio, “Houses will always be incredibly expensive if you can see the Opera House and the Sydney Harbour Bridge, just accept that. What people have got to realise is that houses are much cheaper in Tamworth, houses are much cheaper in Armidale, houses are much cheaper in Toowoomba”. Fairfax, the owner of Domain, or more accurately, Domain, the owner of Fairfax, also agrees that “There is no housing bubble, unless you are in Sydney or Melbourne”.
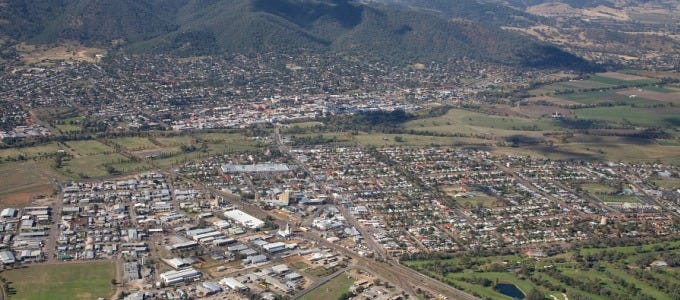
Now probably unbeknownst to Barnaby, who might be more familiar with the New Zealand housing market, in the Demographia International Housing Affordability survey for 2017 Tamworth ranked as the 78th most unaffordable housing marketing in the world. No, you’re not mistaken, this is Tamworth, New South Wales, a regional centre of 42,000 best known as the “Country Music Capital of Australia” and for the ‘Big Golden Guitar’.
According the Australian Bureau of Statistics, the average income in Tamworth is $42,900, the average household income $61,204 but the average house price is $375,000, giving a price to household income ratio of 6.1x, making housing in Tamworth less affordable than Tokyo, Singapore, Dublin or Chicago.
If you used the current Homesales.com.au data, which has the average house price at $394,212, or 6.6x, Tamworth would be in the top 40 most unaffordable housing markets in the world. Yes, Tamworth. Yes, in the world. Unfortunately for Barnaby, Armidale and Toowoomba don’t fare much better.
Tamworth, which at current prices would be in the top 40 most unaffordable housing markets tracked by Demographia in the world. Really? Source: GP Synergy
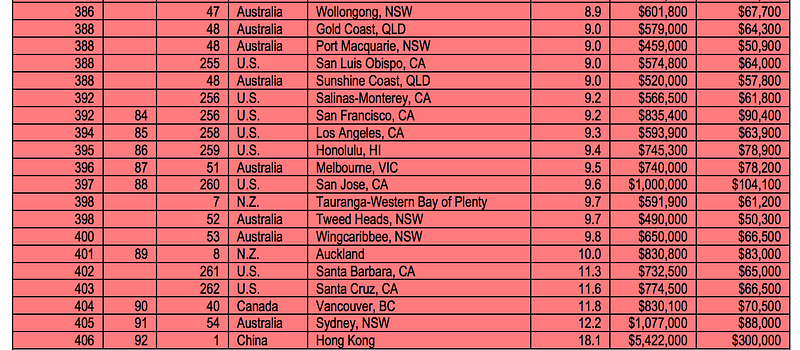
Out of a total of 406 housing markets tracked globally by Demographia, eight (or 40%) of the twenty least affordable housing markets in the world were in Australia, including in addition to Sydney and Melbourne such exotic places as Wingcaribbee, Tweed Heads, the Sunshine Coast, Port Macquarie, the Gold Coast, and Wollongong. Looking at all regional Australian housing markets, they found 33 of 54 markets “severely unaffordable”.
The 20 most unaffordable housing markets in the world. Source: Demographia, 13th Annual Demographic International Housing Affordability Survey:2017
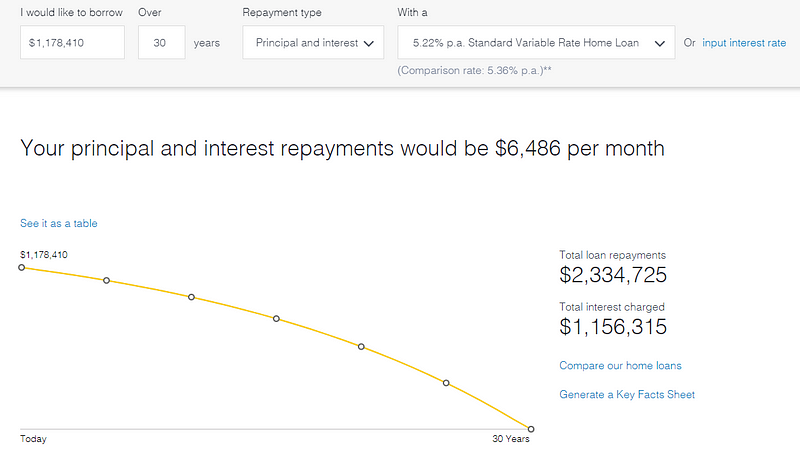
If you borrowed the whole amount to buy a house in Sydney, with a Commonwealth Bank Standard Variable Rate Home Loan currently showing a 5.36% comparison rate (as of 7th October 2017), your repayments would be $6,486 a month, every month, for 30 years. The monthly post tax income for the average wage in Sydney ($80,277.60) is only $5,081.80 a month.
Commonwealth Bank Standard Variable Rate Home Loan for the average house. Source: CBA as of 7th October 2017
In fact, on this average Sydney salary of $80,277.60, the Commonwealth Bank’s “How much can I borrow?” calculator will only lend you $463,000, and this amount has been dropping in the last year I have been looking at it. So good luck to the average person buying anything anywhere near Sydney.
Federal MP Michael Sukkar, Assistant Minister to the Treasurer, says surprisingly that getting a “highly paid job” is the “first step” to owning a home. Perhaps Mr Sukkar is talking about his job, which pays a base salary of $199,040 a year. On this salary, the Commonwealth Bank would allow you to just borrow enough- $1,282,000 to be precise- to buy the average home, but only provided that you have no expenses on a regular basis, such as food. So the Assistant Minister to the Treasurer can’t really afford to buy the average house, unless he tells a porky on his loan application form.
The average Australian is much more likely to be employed as a tradesperson, school teacher, postman or policeman. According to the NSW Police Force’s recruitment website, the average starting salary for a Probationary Constable is $65,000 which rises to $73,651 over five years. On these salaries the Commonwealth Bank will lend you between $375,200 and $419,200 (again provided you don’t eat), which won’t let you buy a house really anywhere.
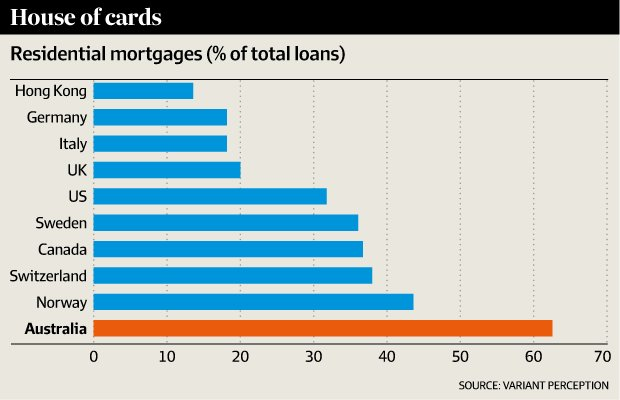
Unsurprisingly, the CEOs of the Big Four banks in Australia think that these prices are “justified by the fundamentals”. More likely because the Big Four, who issue over 80% of residential mortgages in the country, are more exposed as a percentage of loans than any other banks in the world, over double that of the U.S. and triple that of the U.K., and remarkably quadruple that of Hong Kong, which is the least affordable place in the world for real estate. Today, over 60% of the Australian banks’ loan books are residential mortgages. Houston, we have a problem.
Residential Mortgages as a percentage of total loans. Source: IMF (2015)
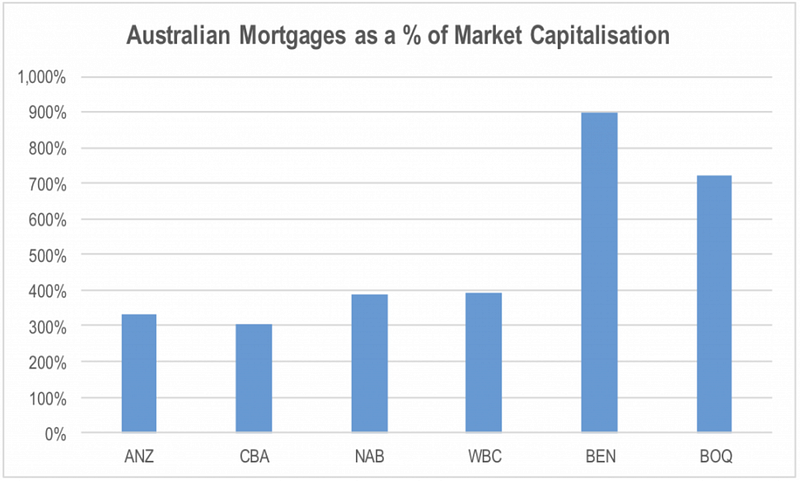
It’s actually worse in regional areas where Bendigo Bank and the Bank of Queensland are holding huge portfolios of mortgages between 700 to 900% of their market capitalisation, because there’s no other meaningful businesses to lend to.
Australian banks’ mortgage exposure as a percentage of market capitalisation. Source: Roger Montgomery, Company data
I’m not sure how the fundamentals can possibly be justified when the average person in Sydney can’t actually afford to buy the average house in Sydney, no matter how many decades they try to push the loan out.
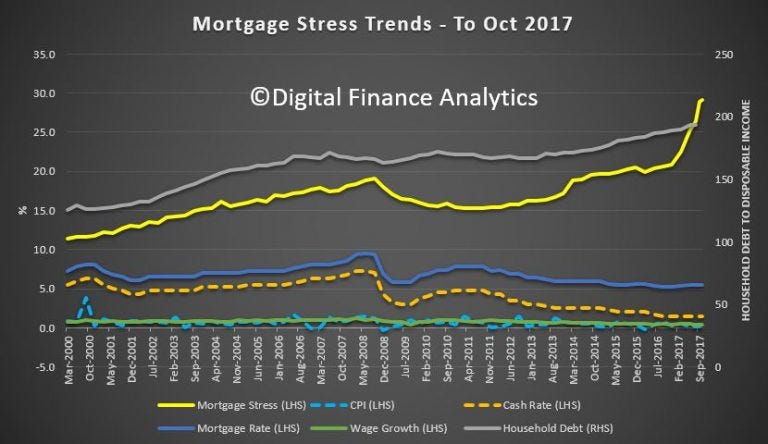
Mortgage Stress Trends to Oct 2017. Source: Digital Finance Analytics
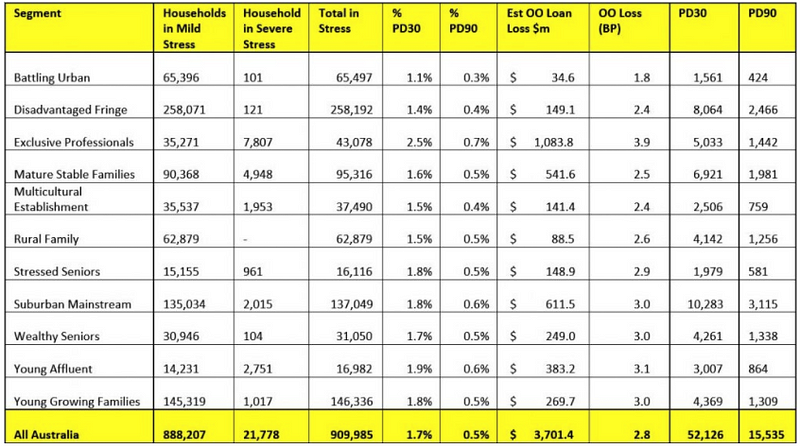
Indeed Digital Finance Analytics estimated in a October 2017 report that 910,000 households are now estimated to be in mortgage stress where net income does not covering ongoing costs. This has skyrocketed up 50% in less than a year and now represents 29.2% of all households in Australia. Things are about to get real.
Probability of default in 30, 90 days across Australian demographics in October 2017. Source: Digital Finance Analytics
It’s well known that high levels of household debt are negative for economic growth, in fact economists have found a strong link between high levels of household debt and economic crises.
This is not good debt, this is bad debt. It’s not debt being used by businesses to fund capital purchases and increase productivity. This is not debt that is being used to produce, it is debt being used to consume. If debt is being used to produce, there is a means to repay the loan. If a business borrows money to buy some equipment that increases the productivity of their workers, then the increased productivity leads to increased profits, which can be used to service the debt, and the borrower is better off. The lender is also better off, because they also get interest on their loan. This is a smart use of debt. Consumer debt generates very little income for the consumer themselves. If consumers borrow to buy a new TV or go on a holiday, that doesn’t create any cash flow. To repay the debt, the consumer generally has to consume less in the future. Further, it is well known that consumption is correlated to demographics, young people buy things to grow their families and old people consolidate, downsize and consume less over time. As the aging demographic wave unfolds across the next decade there will be significantly less consumers and significantly more savers. This is worsened as the new generations will carry the debt burden of student loans, further reducing consumption.

Parody of Sydney real estate, or is it?
So why are governments so keen to inflate housing prices?
The government loves Australians buying up houses, particularly new apartments, because in the short term it stimulates growth?—?in fact it’s the only thing really stimulating GDP growth.
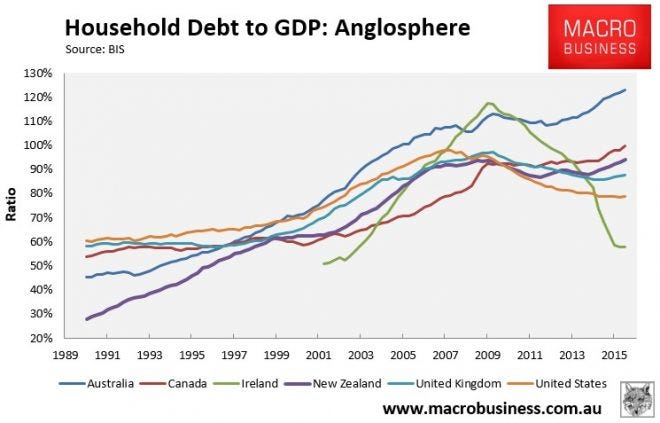
Australia has around $2 trillion in unconsolidated household debt relative to $1.6 trillion in GDP, making this country in recent quarters the most indebted on this ratio in the world. According to Treasurer Scott Morrison 80% of all household debt is residential mortgage debt. This is up from 47% in 1990.
Australia Household Debt to GDP. Source: Bank for International Settlements, Macro Business
Australia’s household debt servicing ratio (DSR) ties with Norway as the second worst in the world. Despite record low interest rates, Australians are forking out more of their income to pay off interest than when we had record mortgage rates back in 1989–90 which are over double what they are now.
Everyone’s too busy watching Netflix and cash strapped paying off their mortgage to have much in the way of any discretionary spending. No wonder retail is collapsing in Australia.
Governments fan the flame of this rising unsustainable debt fuelled growth as both a source of tax revenue and as false proof to voters of their policies resulting in economic success. Rather than modernising the economy, they have us on a debt fuelled housing binge, a binge we can’t afford.
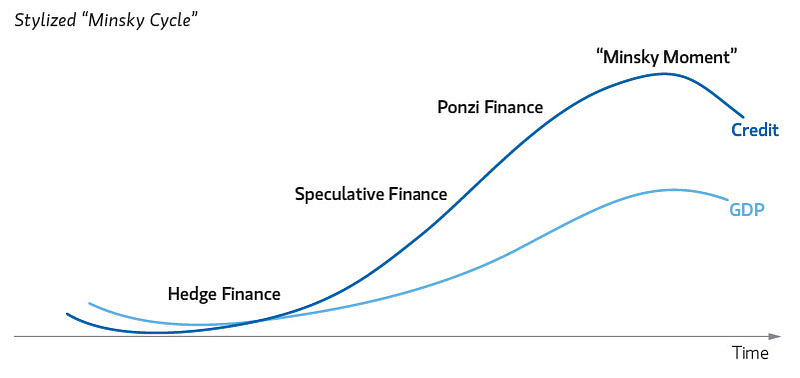
We are well past overtime, we are into injury time. We’re about to have our Minsky moment: “a sudden major collapse of asset values which is part of the credit cycle.”
Such moments occur because long periods of prosperity and rising valuations of investments lead to increasing speculation using borrowed money. The spiraling debt incurred in financing speculative investments leads to cash flow problems for investors. The cash generated by their assets is no longer sufficient to pay off the debt they took on to acquire them. Losses on such speculative assets prompt lenders to call in their loans. This is likely to lead to a collapse of asset values. Meanwhile, the over-indebted investors are forced to sell even their less-speculative positions to make good on their loans. However, at this point no counterparty can be found to bid at the high asking prices previously quoted. This starts a major sell-off, leading to a sudden and precipitous collapse in market-clearing asset prices, a sharp drop in market liquidity, and a severe demand for cash.
The Minsky Cycle. Source: Economic Sociology and Political Economy
The Governor of the People’s Bank of China recently warned that extreme credit creation, asset speculation and property bubbles could pose a “systemic financial risk” in China. Zhou Xiaochuan said “If there is too much pro-cyclical stimulus in an economy, fluctuations will be hugely amplified. Too much exuberance when things are going well causes tensions to build up. That could lead to a sharp correction, and eventually lead to a so-called Minsky Moment. That’s what we must really guard against”. A Minsky moment in China would be an extreme event for the parasite on the vein of Chinese credit stimulus- the Australian economy.
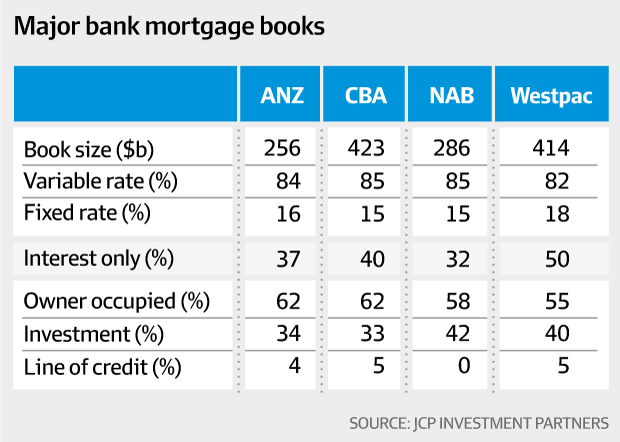
Today 42% of all mortgages in Australia are interest only, because since the average person can’t afford to actually pay for the average house- they only pay off the interest. They’re hoping that value of their house will continue to rise and the only way they can profit is if they find some other mug to buy it at a higher price. In the case of Westpac, 50% of their entire residential mortgage book is interest only loans.
Percentage of interest only loans by bank. Source: JCP Investment Partners, AFR
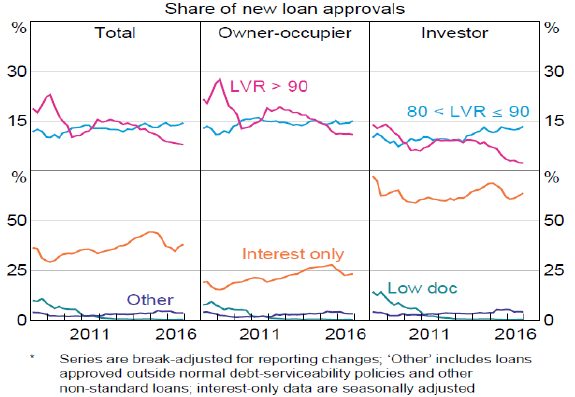
And a staggering 64% of all investor loans are interest only.
Share of new loan approvals for Australian banks. Source: APRA, RBA, UBS
This is rapidly approaching ponzi financing.
This is the final stage of an asset bubble before it pops.
Today residential property as an asset class is four times larger than the sharemarket. It’s illiquid, and the $1.5 trillion of leverage is roughly equivalent in size to the entire market capitalisation of the ASX 200. Any time there is illiquidity and leverage, there is a recipe for disaster- when prices move south, equity is rapidly wiped out precipitating panic selling into a freefall market with no bids to hit.
The risks of illiquidity and leverage in the residential property market flow through the entire financial system because they are directly linked; today in Australia the Big Four banks plus Macquarie are roughly 30% of the ASX200 index weighting. Every month, 9.5% of the entire Australian wage bill goes into superannuation, where 14% directly goes into property and 23% into Australian equities- of which 30% of the main equity benchmark is the banks.
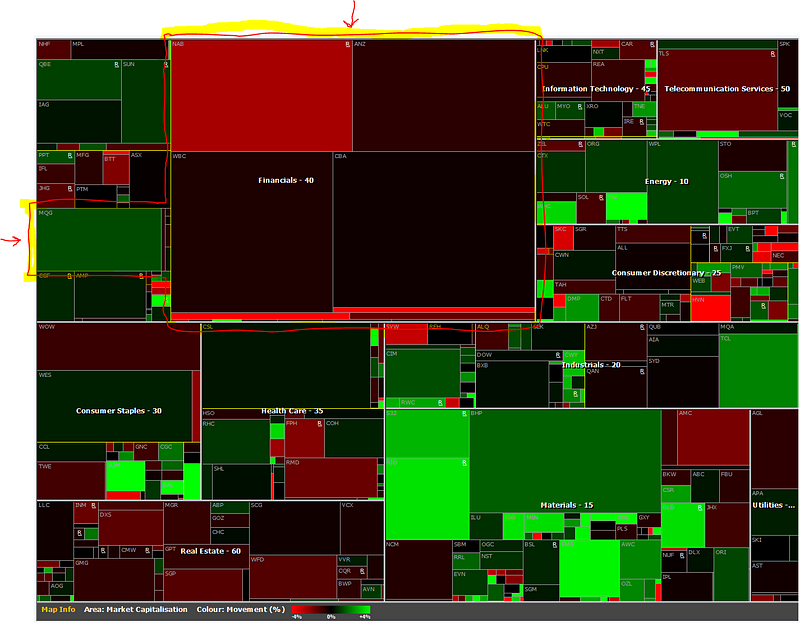
ASX200 by market capitalisation, Big 4 banks top and Macquarie on the left (arrows). Source: IRESS
You don’t read objective reporting on property in the Australian media, which Llewelyn-Smith from Macro Business calls “a duopoly between a conservative Murdoch press and liberal Fairfax press. But both are loss-making old media empires whose only major growth profit centres are the nation’s two largest real estate portals, realestate.com.au and Domain. Neither report real estate with any objective other than the further inflation of prices. In the event that the Australian bubble were to pop then Australians will certainly be the last to know and the propaganda is so thick that they may never find out until they actually try to sell.”
Take, for example, this recent headline from the Fairfax owned Sydney Morning Herald on March 1st 2017, “Meet Daniel Walsh, the 26-year-old train driver with $3 million worth of property”. It appeared in the property section, which for Fairfax today sits on the homepage of their masthead publications, such as the Sydney Morning Herald, immediately below the top headlines for the day and above State News, Global Politics, Business, Entertainment, Technology and the Arts. The article holds up 26 year old Daniel, who services five million dollars worth of property with a train driver’s salary and $2,000 a week of positive cash flow.
This is what the Australian press more commonly holds up as a role model to young people. Not a young engineer who has developed a revolutionary new product or breakthrough, but an over leveraged train driver with a property portfolio on mostly borrowed money where a 1% move in interest rates will wipe out the entirety of this cash flow.
Yet this young train driver isn’t an isolated case, there are literally hoards of these young folk parlaying one property debt onto another in the mistaken belief that property prices only ever go up. Jennifer Duke, an “audience-driven reporter, with a background in real estate and finance” from Domain, also promotes Robert, a 20 year old, who had managed to accumulate three properties in two years using an initial $60,000 gift from his mum. Jeremy, a 24 year old accountant, has 8 properties with a loan to value ratio of 70%, Edward, a 24 year old customer service representative, has 6 properties despite a debt level of 69% and a salary under $50,000, and Taku, the Uber driver, has 8 properties, with plans for 10 covered by a net equity position of only $1 million by November 2017.
How a train driver can service five million dollars of property on $2,000 a week of positive cash flow comes through the magic of cross-collateralised residential mortgages, where Australian banks allow the unrealised capital gain of one property to secure financing to purchase another property. This unrealised capital gain substitutes for what normally would be a cash deposit. This house of cards is described by LF Economics as a “classic mortgage ponzi finance model”. When the housing market moves south, this unrealised capital gain will rapidly become a loss, and the whole portfolio will become undone. The similarities to underestimation of the probability of default correlation in Collateralised Debt Obligations (CDOs), which led to the Global Financial Crisis, are striking.
Fairfax’s pre-IPO real estate website Domain runs these stories every week across the capital city main mastheads enticing young people into property flipping as a get rich quick scheme. All of them are young, with low incomes, leveraging one property purchase on to another.
At Fairfax?—?whose latest half year 2017 financial results had Domain Group EBITDA at $57.3 million and the entire Australian Metro Media which includes Australia’s premier mastheads Australian Financial Review, Sydney Morning Herald, the Age, Digital Ventures, Life and Events EBITDA at $27.7 million?—?property is clearly the most important section of all.
In between holding up this 26 year old train driving property tycoon as something to aspire to, Jennifer has penned other noteworthy articles, such as “No surprise the young support lock-out laws” which parroted incredulous propaganda claiming that young people supported laws designed to shut down places where young people go?—?Sydney’s major entertainment districts.
As if the Australian economy needed further headwinds, the developer-enamoured evangelical right have crucified NSW’s night time economy. Reactionary puritans and opportunists alike seized on some unfortunate incidents involving violence to simply close the economy at night. NSW State Government, City of Sydney, Casinos, NSW Police, public health nannies, property-crazy media and, of course, property developers had the collective interest to manufacture and blow up a fake health & safety issue to create lockout laws?—?and then instituted broad night time economic terraforming policies designed to herd patrons to large casinos so they could become permanent monopoly owners of the night time economy in Sydney and Brisbane, while conveniently damaging the balance sheets of small businesses located in competing entertainment areas, so the property could be demolished and turned into apartment blocks.
Property watching at Fairfax has become a fetish. Almost on a daily basis Lucy Macken, Domain’s Prestige Property Reporter, publishes a gossip column of who bought what house, complete with the full address and photos of the exterior and interior and any financial information she can glean about them. I know of one person whose house was robbed?—?completely cleaned out?—?shortly after Macken published their full address. Perhaps that was a coincidence, but I am utterly amazed that Fairfax senior management allows this column to exist given the risks it poses to the people whose houses and private details are splashed across its pages.
Fairfax, to be fair, is not without its fair share of great journalists, albeit a species rapidly becoming extinct, who are very well aware of what is really going on. Elizabeth Farrelly writes, “Just when you thought the government couldn’t get any madder or badder in its overarching Mission Destroy Sydney?—?when it seemed to have flogged every floggable asset, breached every democratic principle, whittled every beloved park, disempowered every significant municipality and betrayed every promise of decency, implicit or explicit?—?it now wants to remove council planning powers. The excuse, naturally, is ‘probity’. Somehow we’re meant to believe that locally elected people are inherently more corrupt than those elected at state level, and that this puts local decision-making into the greedy mitts of Big Developers”.
However, despite the picture Domain would like to paint, young people with jobs aren’t responsible for driving house prices up, in fact their ownership is at an all time low.
In 2015–16 there were 40,149 residential real estate applications from foreigners valued at over $72 billion in the latest data by FIRB. This is up 244% by count and 320% by value from just three years before.
To put this 40,149 in comparison, in the latest 12 months to the end of April 2017, according to the Australian Bureau of Statistics, a total of 57,446 new residential dwellings were approved in Greater Sydney, and 56,576 in Greater Melbourne.
Even more shocking, in the month of January 2017, the number of first home buyers in the whole of New South Wales was 1,029?—?the lowest level since mortgage rates peaked in the 1990s. Half of those first home buyers rely upon their parents for equity.
The 114,022 new residential dwellings in Sydney and Melbourne in 2015–16 should also be put in comparison to a net annual gain of 182,165 overseas immigrants to Australia of which around 75% go to New South Wales or Victoria.
This brings me onto Australia’s third largest export which is $22 billion in “education-related travel services”. Ask the average person in the street, and they would have no idea what that is and, at least in some part, it is an $18.8 billion dollar immigration industry dressed up as “education”. You now know what all these tinpot “english”, “IT” and “business colleges” that have popped up downtown are about. They’re not about providing quality education, they are about gaming the immigration system.
In 2014, 163,542 international students commenced English language programmes in Australia, almost doubling in the last 10 years. This is through the booming ELICOS (English Language Intensive Courses for Overseas Students) sector, the first step for further education and permanent residency.
This whole process doesn’t seem too hard when you take a look at what is on offer. While the federal government recently removed around 200 occupations from the Skilled Occupations List, including such gems as Amusement Centre Manager (149111), Betting Agency Manager (142113), Goat Farmer (121315), Dog or Horse Racing Official (452318), Pottery or Ceramic Artist (211412) and Parole Officer (411714)?—?you can still immigrate to Australia as a Naturopath (252213), Baker (351111), Cook (351411), Librarian (224611) or Dietician (251111).
Believe it or not, up until recently we were also importing Migration Agents (224913). You can’t make this up. I simply do not understand why we are importing people to work in relatively unskilled jobs such as kitchen hands in pubs or cooks in suburban curry houses.
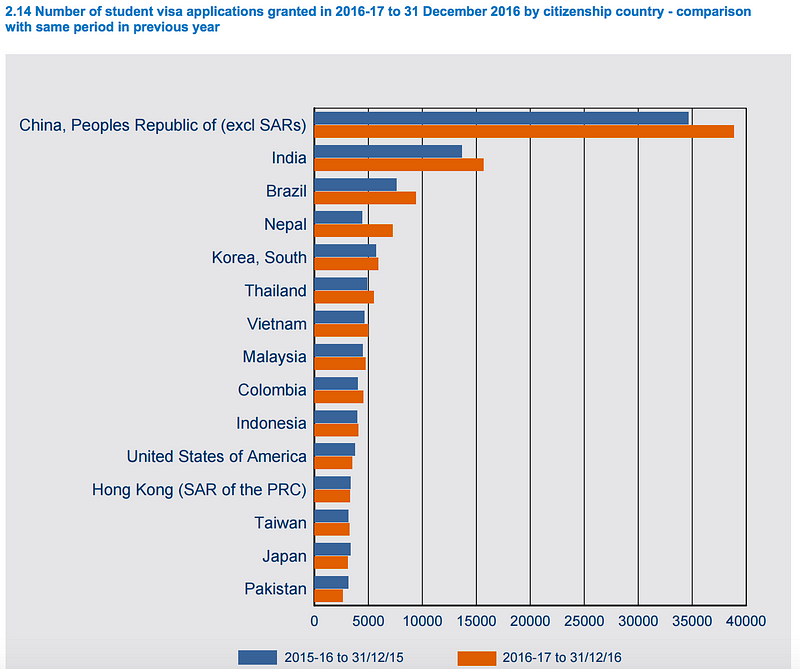
At its peak in October 2016, before the summer holidays, there were 486,780 student visa holders in the country, or 1 in 50 people in the country held a student visa. The grant rate in 4Q16 for such student visa applications was 92.3%. The number one country for student visa applications by far was, you guessed it, China.
Number of Student Visa Applications by Country 2015–16. Source: Department of Immigration and Border Protection
While some of these students are studying technical degrees that are vitally needed to power the future of the economy, a cynic would say that the majority of this program is designed as a crutch to prop up housing prices and government revenue from taxation in a flagging economy. After all, it doesn’t look that hard to borrow 90% of a property’s value from Australian lenders on a 457 visa. Quoting directly from one mortgage lender, “you’re likely to be approved if you have at least a year on your visa, most of your savings already in Australia and you have a stable job in sought after profession”?—?presumably as sought after as an Amusement Centre Manager. How much the banks will be left to carry when the market turns and these students flee the burden of negative equity is anyone’s guess.
In a submission to a senate economics committee by Lindsay David from LF Economics, “We found 21 Australian lending institutions where there is evidence of people’s loan application forms being fudged”.
The ultimate cost to the Australian taxpayer is yet to be known. However the situation got so bad that the RBA had to tell the Big Four banks to cease and desist from all foreign mortgage lending without identified Australian sources of income.
Ken Sayer, Chief Executive of non-bank Mortgage House said “It is much bigger than everyone is making it out to be. The numbers could be astronomical”.
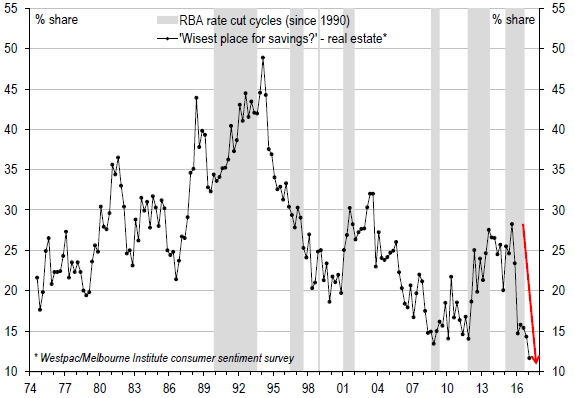
So we are building all these dwellings, but they are not for new Australian home owners. The Westpac-Melbourne Institute has overall consumer sentiment for housing at a 40 year low of 10.5%.
Instead we are building these dwellings to be the new Swiss Bank account for foreign investors.
Share of consumers saying ‘wisest place for saving’ is real estate. Source: ABS, RBA, Westpac, Melbourne Institute, UBS
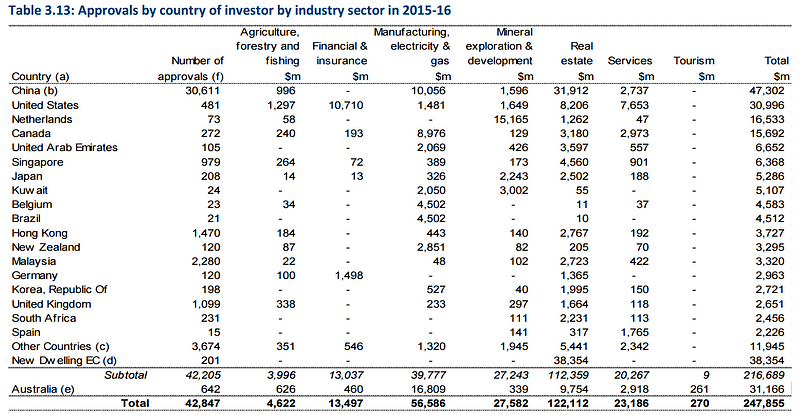
Foreign investment can be great as long as it flows into the right sectors. Around $32 billion invested in real estate was from Chinese investors in 2015–16, making it the largest investment in an industry sector by a country by far. By comparison in the same year, China invested only $1.6 billion in our mining industry. Last year, twenty times more more money flowed into real estate from China than into our entire mineral exploration and development industry. Almost none of it flows into our technology sector.
Approvals by country of investor by industry sector in 2015–6. Source: FIRB
The total number of FIRB approvals from China was 30,611. By comparison. The United States had 481 approvals.
Foreign investment across all countries into real estate as a whole was the largest sector for foreign investment approval at $112 billion, accounting for around 50% of all FIRB approvals by value and 97% by count across all sectors?—?agriculture, forestry, manufacturing, tourism?—?you name it in 2015–16.
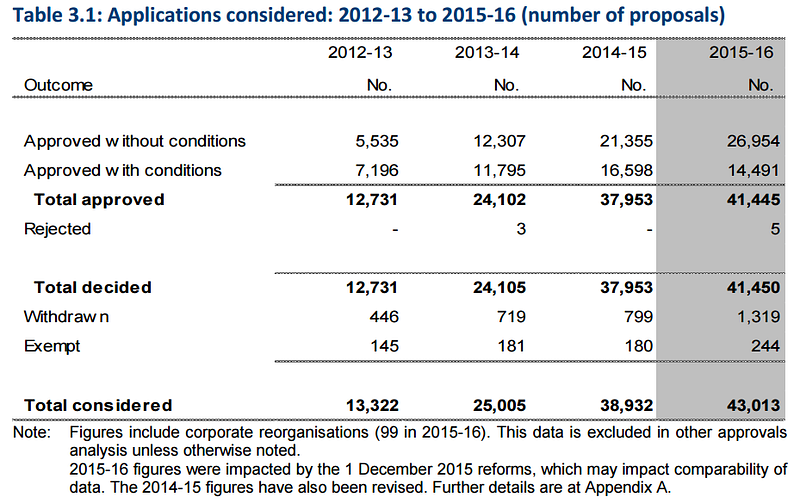
In fact it doesn’t seem that hard to get FIRB approval in Australia, for really anything at all. Of the 41,450 applications by foreigners to buy something in 2015–16, five were rejected. In the year before, out of 37,953 applications zero were rejected. Out of the 116,234 applications from 2012 to 2016, a total of eight were rejected.
Applications for FIRB consideration, approved versus rejected 2012–13 to 2015–6. Source: FIRB
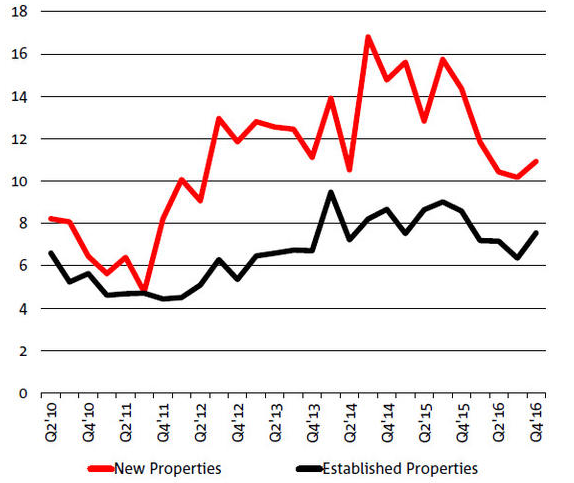
According to Credit Suisse, foreigners are acquiring 25 percent of newly completed housing supply in NSW, worth a total of $39 billion.
Demand for Property from Foreign Buyers in NSW (% of total, unstacked). Source: NAB, SBS
In some circumstances, the numbers however could be much higher. Lend Lease, the Australian construction goliath with over $15 billion in revenue in 2016, stated in that year’s annual report that over 40% of Lend Lease’s apartment sales were to foreigners.
I wouldn’t have a problem with this if it weren’t for the fact that this is all a byproduct of central bank madness, not true supply and demand, and people vital for running the economy can’t afford to live here any more.
What is also remarkable about all of this is that technically, the Chinese are not allowed to send large sums of money overseas. Citizens of China can normally only convert US$50,000 a year in foreign currency and have long been barred from buying property overseas, but those rules have not been enforced. They’ve only started cracking down on this now.
Despite this, up until now, Australian property developers and the Australian Government have been more than happy to accommodate Chinese money laundering.
After the crackdown in capital controls, Lend Lease says there has been a big upswing with between 30 to 40% of foreign purchases now being cash settled. Other developers are reporting that some Chinese buyers are paying 100% cash. The laundering of Chinese cash into property isn’t unique to Australia, it’s just that Transparency International names Australia, in their March 2017 report as the worst money laundering property market in the world.
Australia is not alone, Chinese “hot money” is blowing gigantic property bubbles in many other safe havens around the world.
But combined with our lack of future proof industries and exports, our economy is complete stuffed. And it’s only going to get worse unless we make a major transformation of the Australian economy.
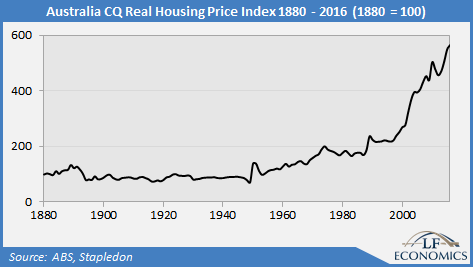
We can’t rely on property to provide for our future. In 1880, Melbourne was the richest city in the world, until it had a property crash in 1891 where house prices halved causing Australia’s real GDP to crash by 10 per cent in 1892 and 7 per cent the year after. The depression of the 1890s caused by this crash was substantially deeper and more prolonged than the great depression of the 1930s. Macro Business points out that if you bought a house at the top of the market in 1890s, it took seventy years for you to break even again.
Australia CQ Real Housing Price Index 1890–2016. Source: LF Economics, Macro Business
Instead of relying on a property bubble as pretense that our economy is strong, we need serious structural change to the composition of GDP that’s substantially more sophisticated in terms of the industries that contribute to it.
Australia’s GDP of $1.6 trillion is 69% services. Our “economic miracle” of GDP growth comes from digging rocks out of the ground, shipping the by-products of dead fossils, and stuff we grow. Mining, which used to be 19%, is now 7% and falling. Combined, the three industries now contribute just 12% of GDP thanks to the global collapse in commodities prices.
If you look at businesses as a whole, Company tax hasn’t moved from $68 billion in the last three years?—?our companies are not making more profits. This country is sick.
Indeed if you look at the budget, about the only thing going up in terms of revenue for the federal government are taxes on you having a good time- taxes on beer, wine, spirits, luxury cars, cigarettes and the like. It would probably shock the average person on the street to discover that the government collects more tax from cigarettes ($9.8 billion) than it collects from tax on superannuation ($6.8 billion), over double what it collects from Fringe Benefits Tax ($4.4 billion) and over thirteen times more tax than it does from our oil fields ($741 million).
Turnbull is increasing the tax on cigarettes by 12.5% a year for the next four years. In the latest federal budget, the government forecasts that by 2020 that it will collect $15.2 billion from taxes on tobacco per annum. This is four times the amount that the government collects from the entire coal industry per annum.
Just compare these numbers: $15 billion is over double what the government projects it will collect from petrol excise in that year ($7.15b), 21 times what it will collect from luxury car tax ($720m), 27 times what it will collect from taxes on imported cars ($560m) and 89 times what it will collect from customs duty on textile and footwear imports ($170m).
As a sign of how addicted to taxing you the government has become, look at the myriad of taxes on cars?—?high import duties, stamp duty and a luxury car tax?—?these were designed to protect a car manufacturing industry which doesn’t exist anymore. Yet the government is still increasing them. We closed the last factory this year. These taxes are not only blatant cash grabs but serve to stifle the deployment of electric cars, which have hit a dead end in Australia. Likewise, the taxes on textile and footwear imports were originally designed to protect our textiles, an industry that has now collapsed and that lost 30% of its manufacturing workers this year.
If you look through federal budget forecasts, taxes on cigarettes is the only thing practically floating the federal government’s finances other than wishful thinking in forward projections. Which is, of course, some other future administration’s problem.
How they think they can raise $15 billion in taxes per year on cigarettes?—?a product that costs a cent per stick to make and will retail for almost $2 a stick in 2020?—?without creating a thriving black market, another Pablo Escobar and throwing hundreds, perhaps thousands of people in jail, who will decide unwisely to participate in that black market, astounds me. But that’s how the government decides to plug the hole in its accounts instead of cutting spending.
Of course like so many things this all gets sold to you, the general population, under the banner of “health and safety”- and it’s easy to sell because all you need to do is parade out a few patronising doctors. The truth is that it’s really just for the health and safety of the government budget, because the economy is really, really sick.
If the government wants to fix the budget, I would have thought the most practical way to do it would be to find ways to grow the economy. You’ll never wean the government off wasteful spending no matter who is in power. The politicians, after all, need to keep that up in order to buy votes through profligate policies such as welfare for the middle class.
But instead of thinking of intelligent ways to grow the economy, the focus is purely on finding more ways to tax you. Just think of all the times over the last couple of years, all the random thought bubbles, that various politicians have proposed raising taxes on superannuation, high earners, banks, property, tripling fines for cyclists, tripling fines for companies, the GST to 15% or 20%, the GST on low value imports, the GST on digital goods, stamp duty, alcohol, sugar, red meat, it’s endless.
They are even proposing banning the $100 note, so that when the RBA drives interest rates negative, you won’t be able to withdraw your hard earned funds in cash so easily. You’ll either have to spend it or have the rude shock of the bank taking money out of your account each month rather than earning interest.
Here’s a crazy idea: the dominant government revenue line is income tax. Income tax is generated from wages. Education has always been the lubricant of upward mobility, so perhaps if we find ways to encourage our citizens to study in the right areas?—?for example science & engineering?—?then maybe they might get better jobs or create better jobs and ultimately earn higher wages and pay more tax.
Instead the government proposed the biggest cuts to university funding in 20 years with a new “efficiency dividend” cutting funding by $1.2 billion, increasing student fees by 7.5 percent and slashing the HECS repayment threshold from $55,874 to $42,000. These changes would make one year of postgraduate study in Electrical Engineering at the University of New South Wales cost about $34,000.
We should be encouraging more people into engineering, not discouraging them by making their degrees ridiculously expensive. In my books, the expected net present value of future income tax receipts alone from that person pursuing a career in technology would far outweigh the short sighted sugar hit from making such a degree more costly?—?let alone the expected net present value of wealth creation if that person decides to start a company. The technology industry is inherently entrepreneurial, because technology companies create new products and services.
Speaking of companies, how about as a country we start having a good think about what sorts of industries we want to have a meaningful contribution to GDP in the coming decades?
For a start, we need to elaborately transform the commodities we produce into higher end, higher margin products. Manufacturing contributes 5% to GDP. In the last ten years, we have lost 100,000 jobs in manufacturing. Part of the problem is that the manufacturing we do has largely become commoditised while our labour force remains one of the most expensive in the world. This cost is further exacerbated by our trade unions?—?in the case of the car industry, the government had to subsidise the cost of union work practices, which ultimately failed to keep the industry alive. So if our people are going to cost a lot, we better be manufacturing high end products or using advanced manufacturing techniques otherwise other countries will do it cheaper and naturally it’s all going to leave.
Last year, for example, 30.3% of all manufacturing jobs in the textile, leather, clothing & footwear industries were lost in this country. Yes, a third. People still need clothes, but you don’t need expensive Australians to make them, you can make them anywhere.
That’s why we need to seriously talk about technology, because technology is the great wealth and productivity multiplier.
However the thinking at the top of government is all wrong.
I recently heard a speech by the Chief Scientist of Australia where he held up a smashed avocado on toast as a prime example of Australian innovation. Yes, smashed avocado on toast. I am not sure which Australian company has the patent on smashed avocados on toast?—?it’s too surreal to even think about.
Australian Innovation according to the Chief Scientist of Australia. Source: ChiefScientist.gov.au
In the same speech, he said that an Australian iron ore mine is every bit as innovative as a semiconductor fabrication plant. My mind was seriously blown.
You can throw as much automation, AI and robotics at an iron ore mine as technologically possible, but it doesn’t change the fact that mines are, and always will be wasting assets that output a commodity for which we are a price taker, not a price maker, into what is currently an oversupplied global market. An iron ore mine, not matter how advanced, is not a long term scalable productivity multiplier; it is a resource to be extracted with finite supply. Once it’s gone, the robots will be dormant.
A semiconductor fabrication plant on the other hand, makes automation of the mine possible. It powers the robotics, the AI and the software?—?not just for the iron ore mine, but factories and businesses all over the world. It’s the real productivity and wealth multiplier. It’s a long term sustainable, competitive advantage. Smart and efficient resource extraction is just an application of this technology.
That’s why we shouldn’t get confused about what is a technology company, because there is no other industry that can create such immense wealth, with such capital efficiency and long term benefit to the world, as the technology industry.
Today, the largest public company in the world, Apple, is a technology company. Apple’s market capitalisation of $810 billion is bigger than the entire US retail market sector. Its revenue of over $215 billion generates over US$2 million dollars per employee per year. And that’s just the company directly. Think of all the business, jobs, wealth creation and benefits to society that have come indirectly from using the company’s computers, mobile devices, software, services and products.
The largest four companies by market capitalisation globally as of the end of Q2 2017 globally were Apple, Alphabet, Microsoft and Amazon. Facebook is eight. Together, these five companies generate over half a trillion dollars in revenue per annum. That’s equivalent to about half of Australia’s entire GDP. And many of these companies are still growing revenue at rates of 30% or more per annum.
These are exactly the sorts of companies that we need to be building.
With our population of 24 million and labour force of 12 million, there’s no other industry that can deliver long term productivity and wealth multipliers like technology. Today Australia’s economy is in the stone age. Literally.
By comparison, Australia’s top 10 companies are a bank, a bank, a bank, a mine, a bank, a biotechnology company (yay!), a conglomerate of mines and supermarkets, a monopoly telephone company, a supermarket and a bank.
We live in a monumental time in history where technology is remapping and reshaping industry after industry?—?as Marc Andreessen said “Software is eating the world!”?—?many people would be well aware we are in a technology gold rush.
And they would be also well aware that Australia is completely missing out.
Most worrying to me, the number of students studying information technology in Australia has fallen by between 40 and 60% in the last decade depending on whose numbers you look at. Likewise, enrollments in other hard sciences and STEM subjects such as maths, physics and chemistry are falling too. Enrolments in engineering have been rising, but way too slowly.
This is all while we have had a 40% increase in new undergraduate students as a whole.
Women once made up 25 percent of students commencing a technology degree, they are now closer to 10 percent.
All this in the middle of a historic boom in technology. This situation is an absolute crisis. If there is one thing, and one thing only that you do to fix this industry, it’s get more people into it. To me, the most important thing Australia absolutely has to do is build a world class science & technology curriculum in our K-12 system so that more kids go on to do engineering.
In terms of maths & science, the secondary school system has declined so far now that the top 10% of 15-year olds are on par with the 40–50% band of of students in Singapore, South Korea and Taiwan.
For technology, we lump a couple of horrendous subjects about technology in with woodwork and home economics. In 2017, I am not sure why teaching kids to make a wooden photo frame or bake a cake are considered by the department of education as being on par with software engineering. Yes there is a little bit of change coming, but it’s mostly lip service.
Meanwhile, in Estonia, 100% of publicly educated students will learn how to code starting at age 7 or 8 in first grade, and continue all the way to age 16 in their final year of school.
At my company, Freelancer.com, we’ll hire as many good software developers as we can get. We’re lucky to get one good applicant per day. On the contrary, when I put up a job for an Office Manager, I received 350 applicants in 2 days.
But unfortunately the curriculum in high school continues to slide, and it pays lip service to technology and while kids would love to design mobile apps, build self-driving cars or design the next Facebook, they come out of high school not knowing that you can actually do this as a career.
I’ve come to the conclusion that it’s actually all too hard to fix?—?and I came to this conclusion a while ago as I was writing some suggestions for the incoming Prime Minister on technology policy. I had a good think about why we are fundamentally held back in Australia from major structural change to our economy to drive innovation.
I kept coming back to the same points.
The problems we face in terraforming Australia to be innovative are systemic, and there is something seriously wrong with how we govern this country.
There are problems throughout the system, from how we choose the Prime Minister, how we govern ourselves, how we make decisions, all the way through.
For a start, we are chronically over governed in this country. This country has 24 million people. It is not a lot. By comparison my website has about 26 million registered users. However this country of 24 million people is governed at the State and Federal level by 17 parliaments with 840 members of parliament. My company has a board of three and a management team of a dozen.
Half of those parliaments are supposed to be representatives directly elected by the people. Frankly, you could probably replace them all with an iPhone app. If you really wanted to know what the people thought about an issue, technology allows you to poll everyone, everywhere, instantly. You’d also get the results basically for free. I’ve always said that if Mark Zuckerberg put a vote button inside Facebook, he’d win a Nobel Peace Prize. Instead we waste a colossal $122 million on a non-binding plebiscite to ask a yes/no question on same sex marriage that shouldn’t need to be asked in the first place, because those that it affects would almost certainly want it, and those that it doesn’t affect should really butt out and let others live their lives as they want to.
Instead these 840 MPs spend all day jeering at each other and thinking up new legislation to churn out.
In 1991, the late and great Kerry Packer said “I mean since I grew up as a boy, I would imagine, that through the parliaments of Australia since I was 18 or 19 years of age till now, there must be 10,000 new laws been passed, and I don’t really think it’s that much better place, and I would like to make a suggestion to you which I think would be far more useful. If you want to pass a new law, why don’t you only do it when you’ve repealed an old one. I mean this idea of just passing legislation, legislation, every time someone blinks is a nonsense. Nobody knows it, nobody understands it, you’ve got to be a lawyer, they’ve got books up to here. Purely and simply just to do the things we used to do. And every time you pass a law, you take somebody’s privileges away from them.”
Last year the Commonwealth parliament alone spewed out 6,482 pages of legislation, adding to over 100,000 pages already enacted. That’s not even looking at State Governments.
In Australia, the average person in the street might think that the way that you get into the Prime Minister’s office is by being elected by the people. Since 1966, this has only been true about 40% of the time.
In fact, of the 15 Prime Ministers since Menzies, only six have come into the office via being elected by the people. Yes, only six since 1966. They were Gough Whitlam in 1972, Bob Hawke in 1983, John Howard in 1996, Kevin Rudd in 2007 and Tony Abbott in 2013 and Malcolm Turnbull in 2016.
The typical way to get into the Prime Minister’s office in Australia is not by being voted in, but by stabbing the incumbent in your own party in the back. Or in the case of Malcolm Fraser, getting the Governor General to do your dirty work for you. That’s how 60% of our Prime Ministers have gotten into office since we stopped using pounds Sterling as currency. It’s crazy.
In the technology industry we had high hopes for number fifteen but it looks like we might be onto our sixteenth very shortly.
I say it looks like we might be onto number 16 shortly as the Australian government is currently in the grips of a major political crisis. A crisis for the absurd reason that a large number of our politicians do not know they were a dual citizen of another country (or worse, they tried to hide it)! In Australia this is not allowed under section 44 of the Constitution. On almost a daily basis, members of parliament across the political spectrum have been found to be dual citizens of other countries. This has happened to such an extent that the coalition government has now lost its majority and is teetering at the brink of collapse.
The level of incompetence from these politicians that spend all day dreaming up rules about how we all should live our lives and standards to that our businesses must submit to is astounding, not to mention their parties. I would have thought that the first page of the “So you want to be a politician?” checklist that each party handed out to bright young recruits would have said “Have you stolen any money? Are you a drug addict? Have you fiddled with any kids? Are you a citizen of another nation? Then the career of a politician probably isn’t for you!”.
It’s not like this hasn’t happened before, either.
Now how the sixteenth Prime Minister will pick their team is completely crazy. The problem is section 64 of the Constitution. This is the part that says that federal Ministers?—?members of the executive?—?must sit in Parliament. This is nuts.
Not so long ago the former Minister of Trade for Indonesia, Tom Lembong, visited my company. Tom’s entire career has been in private equity and banking. He’d never been in politics before- Jokowi simply asked him to be Minister of Trade. Similarly the Minister for Communications, Rudiantara, spent his entire career running telecommunications companies. In Indonesia they vote for the President & Vice President, and then separately for the legislature. The President can pick his own team for the executive. This is how you get good people in government, because you can pick people with real world domain expertise to run a portfolio. In Australia we end up with lawyers, evangelicals or career politicians. People who don’t have a clue about their portfolio. Imagine trying to run a company, but instead of of being able to pick the best engineer to be Vice President of Engineering, you have to pick it from a pool of lawyers, crazy people or card carrying political hacks. How can we have a science, technology and engineering focused agenda, which the country critically needs, when this is how cabinet gets chosen?
Then we have the problems that are a result of regulatory duplication, confusion and duplication of responsibilities or the mindless populism of absurd policies of the State Governments. Here I think we have some of the biggest problems.
I ended up doing Electrical Engineering completely by accident. I went to one of the best private schools in the country. When I graduated, at careers day, nobody talked about engineering. In fact, nobody even mentioned the word engineering throughout my entire schooling. I honestly thought it had something to do with driving a train.
I was disheartened to go back to that same school, Sydney Grammar, to talk at careers day. The students still thought that engineering had something to do with driving a train.
This is completely nuts, when I told the students that by working in engineering you get to design satellites, self driving cars, virtual reality helmets, design rockets like those SpaceX will one day send to Mars or build the next Facebook, many in the room got excited. Just they didn’t have a clue how to head towards a career in engineering because it wasn’t mentioned once to them in thirteen years of schooling. It’s not just my old school, almost all the schools are like this.
So how do you fix K-12 education in this country so that we can drive innovation in the future? It’s the remit of the bureaucracy of the State Governments.
Trying to get them to all agree to modernise the economy is an exercise in futility. Since taking power, the NSW Government has sold 384 Department of Education properties. That is despite leaked Department of Education documents that report NSW is facing an influx of 15,000 school students a year, and will require $10.8 billion in funding for 7,500 new classrooms and buildings over just 15 years.
If you look at their profit & loss statements you’ll see the bizarre way in which State Governments think.
The biggest revenue generator for NSW is payroll tax. In NSW companies pay $8.4 billion dollars as a result of this idiotic tax which is basically a penalty imposed on you for hiring a lot of people. $8.4 billion that could be better used employing more people. If I hire a lot of people, I should get a discount, not a penalty.
The second is stamp duty & land tax. NSW collects $7.8 billion of stamp duty. This is a tax that simply makes it expensive to transact. The stamp duty on an average house in Sydney is $42,000, or about 70% of the average NSW citizens’ post tax annual income. The average person has to work for most of year just to be able to transact in the housing market. The illiquidity this tax causes will be one of the biggest pain points behind a housing crash.
The State Government then tries to build a road between all these apartments, and because property and construction costs are too high, Westconnex, a 33 kilometer road, will cost between $20 and $40 billion. Trump’s wall, which is 1600 km long is costed at around $15 billion.
When the NSW government proposes to build a 14 kilometer tunnel to Manly, it’s costed at $14 billion dollars. That’s $1 million dollars per metre just to build. At $14 billion, that’s about the same price Gotthard tunnel cost, which is the deepest and longest tunnel in the world which goes for 57 kilometers under the Swiss Alps, 2.3 km below the surface of the mountains above and through 73 different kinds of rock at temperatures of up to 46 degrees. Yet a tunnel to Manly costs New South Wales the same price.
This is the absurdity of how State Governments think and operate.
Something is clearly very wrong.
New South Wales also collects $2.4 billion in fees for access to roads, and fines for actually using them. Fines which are erratically enforced through the strategic placement of cameras in areas of maximal revenue, random busts on jaywalkers, through to the ridiculous 350% increase in fines on cyclists for not wearing a helmet, when all the public health policy globally says it’s better to have your citizens ride bikes and get healthy.
It’s so absurd that in NSW a kid riding home on his bike without a helmet now gets fined more ($319) than the speeding driver doing almost 80kms/hr in a 60 zone that ran over him ($269).
Of course, this gets sold to you again under the banner of “health and safety”. But that’s all a load of crap. The only health and safety it’s ensuring is the health and safety of government finances.
This is why I wouldn’t hold your breath for the deployment of electric cars in Australia. State governments will get a rude shock when all of a sudden car ownership collapses and there are no more fines from speeding, red light cameras or poor driving, let alone a crash in fees from parking meters and parking levies. State governments simply won’t let it happen. They’ll also find an excuse to still stop and search your car even though driving under the influence won’t be an adequate excuse anymore.
Why is this important? Well if you are trying to attract young smart people to come back to Australia to join the technology industry, it’s a bit hard when the hashtag #nannystate is trending on Twitter.
After that, all you are left with of any size are gambling and betting taxes. In NSW this is $2.1 billion. The NSW Government is so addicted to gambling revenue that it has shut down most of Sydney’s nightlife in order to boost this line item by funneling people into the casino or pokies rooms, which has the added benefit that they can turn those entertainment areas into apartment blocks for more stamp duty & land tax.
Again, of course, the general public has all been taken for fools because once more it has been sold to you under the guise of “health and safety”. It’s a bit hard to enact structural change in the economy by building a technology industry when every second twenty year old wants to leave because you’ve turned the place into a derelict bumpkin country town.
A little while ago I was sent an essay by Paul Graham of YCombinator, the greatest technology incubator in the world entitled “How to make Pittsburgh into a Startup Hub”. The main thesis of this essay was to make it somewhere that 25–29 year olds want to live?—?build restaurants, cafes, bars and clubs- places that young people want to be.
About young people he said:
I’ve seen how powerful it is for a city to have those people. Five years ago they shifted the center of gravity of Silicon Valley from the peninsula to San Francisco. Google and Facebook are on the peninsula, but the next generation of big winners are all in SF. The reason the center of gravity shifted was the talent war, for programmers especially. Most 25 to 29 year olds want to live in the city, not down in the boring suburbs. So whether they like it or not, founders know they have to be in the city. I know multiple founders who would have preferred to live down in the Valley proper, but who made themselves move to SF because they knew otherwise they’d lose the talent war.
He then went on to say:
It seems like a city has to be very socially liberal to be a startup hub, and it’s pretty clear why. A city has to tolerate strangeness to be a home for startups, because startups are so strange. And you can’t choose to allow just the forms of strangeness that will turn into big startups, because they’re all intermingled. You have to tolerate all strangeness.
Sydney will never be a technology hub if all the young people want to flee overseas.
You’re kidding yourself if you think they are going to come back one day. In the last 18 years that I have been running technology companies in Australia, out of the scores that have left I’d estimate that less than 10 percent come back. They are at the time of their lives where when they go overseas they usually meet a boy or a girl and eventually settle down.
Not so long ago the topic of Innovation was discussed on ABC’s Q&A.
Stephen Merity asked: “I’m an Australian programmer working on machine learning and artificial intelligence in San Francisco after studying at Harvard. I want to return to Australia but I fear it won’t ever be the right choice. Research and educational funding has been slashed, the FTTP NBN has been abolished, and my most competent engineer friends have been left with the choice of leaving home for opportunities or stunting themselves by staying in Australia. Even if all that was fixed, it’s not enough to just prevent brain drain, we need to attract the world’s best talent to Australia. Does the Liberal government truly believe their lacklustre policies can start fixing this divide?”
The response from Labor’s Ed Husic was “Okay. So on the issue of the brain drain, you can take it two ways. Obviously you can, as Stephen was saying, there is some negative factors that drove him away and I’ve had a father email me of a son who said “I had to leave because I didn’t have opportunities, I had to go elsewhere to pursue”, in terms of his science career, you know, pursue opportunity elsewhere. I actually also see the positive in that, you know, a lot of the start-ups, a lot of people that are moving overseas are pursuing opportunity to grow and they’re going to gain experience and potentially come back and replenish our pool. The key for us is if people are leaving, what’s being done to backfill the places? What’s being done to replenish the talent pool?”
This is like a business saying well we have no customer retention because our product is crap, so let’s go find some new customers.
I taught Stephen Merity here at the University of Sydney. He also worked for me at Freelancer. He’s one of the top graduates in computer science that this University and country has ever produced. He’s never coming back.
What about trying to attract more senior people to Sydney?
I’ll tell you what my experience was like trying to attract senior technology talent from Silicon Valley.
I called the top recruiter for engineering in Silicon Valley not so long ago for Vice President role. We are talking a top role, very highly paid. The recruiter that placed the role would earn a hefty six figure commission. This recruiter had placed VPs at Twitter, Uber, Pinterest.
The call with their principal lasted less than a minute “Look, as much as I would like to help you, the answer is no. We just turned down [another billion dollar Australian technology company] for a similar role. We tried placing a split role, half time in Australia and half time in the US. Nobody wanted that. We’ve tried in the past looking, nobody from Silicon Valley wants to come to Australia for any role. We used to think maybe someone would move for a lifestyle thing, but they don’t want to do that anymore.
“It’s not just that they are being paid well, it’s that it’s a backwater and they consider it as two moves?—?they have to move once to get over there but more importantly when they finish they have to move back and it’s hard from them to break back in being out of the action.
“I’m really sorry but we won’t even look at taking a placement for Australia”.
We have serious problems in this country. And I think they are about to become very serious. We are on the wrong trajectory.
I’ll leave you now with one final thought.
Harvard University created something called the Economic Complexity Index. This measure ranks countries based upon their economic diversity- how many different products a country can produce- and economic ubiquity- how many countries are able to make those products.
Where does Australia rank on the global scale?
Worse than Mauritius, Macedonia, Oman, Moldova, Vietnam, Egypt and Botswana.
Worse than Georgia, Kuwait, Colombia, Saudi Arabia, Lebanon and El Salvador.
Sitting embarrassingly and awkwardly between Kazakhstan and Jamaica, and worse than the Dominican Republic at 74 and Guatemala at 75,
Australia ranks off the deep end of the scale at 77th place.
Australia’s ranking in the Harvard Economic Complexity Index 1995–2015. Source: Harvard
77th and falling. After Tajikistan, Australia had the fourth highest loss in Economic Complexity over the last decade, falling 18 places.
Australia keeps good company in the Harvard Economic Complexity Index at position #77. Source: Harvard
Thirty years ago, a time when our Economic Complexity ranked substantially higher, these words rocked the nation:
“We took the view in the 1970s?—?it’s the old cargo cult mentality of Australia that she’ll be right. This is the lucky country, we can dig up another mound of rock and someone will buy it from us, or we can sell a bit of wheat and bit of wool and we will just sort of muddle through … In the 1970s … we became a third world economy selling raw materials and food and we let the sophisticated industrial side fall apart … If in the final analysis Australia is so undisciplined, so disinterested in its salvation and its economic well being, that it doesn’t deal with these fundamental problems … Then you are gone. You are a banana republic.”
Looks like Paul Keating was right.
The national conversation needs to change, now.


